

J. C. Penney Company, Inc. Equity Valuation and Analysis As of ...
J. C. Penney Company, Inc. Equity Valuation and Analysis As of ...
J. C. Penney Company, Inc. Equity Valuation and Analysis As of ...

Create successful ePaper yourself
Turn your PDF publications into a flip-book with our unique Google optimized e-Paper software.
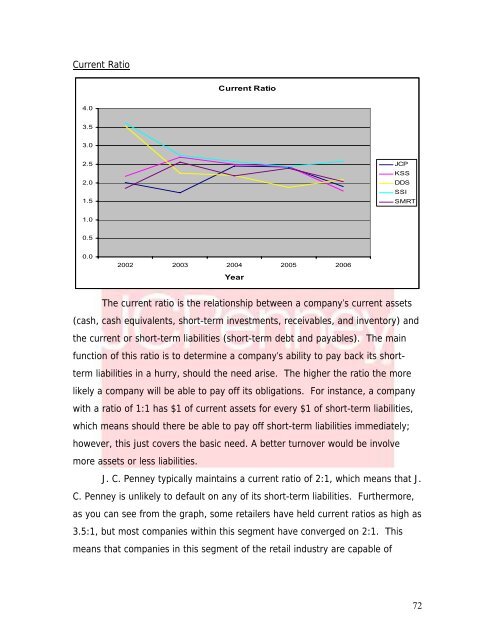
Current RatioCurrent Ratio4.03.53.02.52.01.5JCPKSSDDSSSISMRT1.00.50.02002 2003 2004 2005 2006YearThe current ratio is the relationship between a company’s current assets(cash, cash equivalents, short-term investments, receivables, <strong>and</strong> inventory) <strong>and</strong>the current or short-term liabilities (short-term debt <strong>and</strong> payables). The mainfunction <strong>of</strong> this ratio is to determine a company’s ability to pay back its shorttermliabilities in a hurry, should the need arise. The higher the ratio the morelikely a company will be able to pay <strong>of</strong>f its obligations. For instance, a companywith a ratio <strong>of</strong> 1:1 has $1 <strong>of</strong> current assets for every $1 <strong>of</strong> short-term liabilities,which means should there be able to pay <strong>of</strong>f short-term liabilities immediately;however, this just covers the basic need. A better turnover would be involvemore assets or less liabilities.J. C. <strong>Penney</strong> typically maintains a current ratio <strong>of</strong> 2:1, which means that J.C. <strong>Penney</strong> is unlikely to default on any <strong>of</strong> its short-term liabilities. Furthermore,as you can see from the graph, some retailers have held current ratios as high as3.5:1, but most companies within this segment have converged on 2:1. Thismeans that companies in this segment <strong>of</strong> the retail industry are capable <strong>of</strong>72


