

J. C. Penney Company, Inc. Equity Valuation and Analysis As of ...
J. C. Penney Company, Inc. Equity Valuation and Analysis As of ...
J. C. Penney Company, Inc. Equity Valuation and Analysis As of ...

Create successful ePaper yourself
Turn your PDF publications into a flip-book with our unique Google optimized e-Paper software.
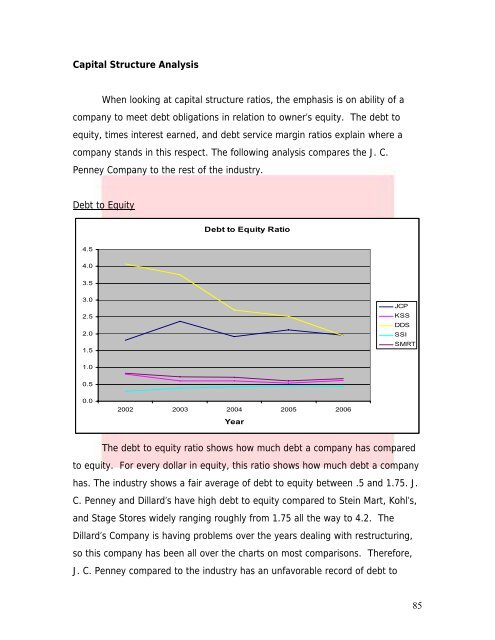
Capital Structure <strong>Analysis</strong>When looking at capital structure ratios, the emphasis is on ability <strong>of</strong> acompany to meet debt obligations in relation to owner’s equity. The debt toequity, times interest earned, <strong>and</strong> debt service margin ratios explain where acompany st<strong>and</strong>s in this respect. The following analysis compares the J. C.<strong>Penney</strong> <strong>Company</strong> to the rest <strong>of</strong> the industry.Debt to <strong>Equity</strong>Debt to <strong>Equity</strong> Ratio4.54.03.53.02.52.01.5JCPKSSDDSSSISMRT1.00.50.02002 2003 2004 2005 2006YearThe debt to equity ratio shows how much debt a company has comparedto equity. For every dollar in equity, this ratio shows how much debt a companyhas. The industry shows a fair average <strong>of</strong> debt to equity between .5 <strong>and</strong> 1.75. J.C. <strong>Penney</strong> <strong>and</strong> Dillard’s have high debt to equity compared to Stein Mart, Kohl’s,<strong>and</strong> Stage Stores widely ranging roughly from 1.75 all the way to 4.2. TheDillard’s <strong>Company</strong> is having problems over the years dealing with restructuring,so this company has been all over the charts on most comparisons. Therefore,J. C. <strong>Penney</strong> compared to the industry has an unfavorable record <strong>of</strong> debt to85


