- Page 2 and 3:
Occasional Papers are written by th
- Page 5 and 6:
OUTLINE OF THE REPORTEXECUTIVE SUMM
- Page 7 and 8:
LIST OF GRAPHSGraph 1. Economic cli
- Page 9:
ACKNOWLEDGEMENTSThe report was prep
- Page 12 and 13:
European CommissionThe Economic Adj
- Page 14 and 15:
European CommissionThe Economic Adj
- Page 16 and 17:
European CommissionThe Economic Adj
- Page 19 and 20:
1. INTRODUCTION1. INTRODUCTION1. Th
- Page 21 and 22:
2. MACROECONOMIC AND FINANCIAL DEVE
- Page 23 and 24:
2. Macroeconomic and financial deve
- Page 25 and 26:
Chart 3Graph 2.3. Exports of goods
- Page 27 and 28:
2. Macroeconomic and financial deve
- Page 29:
2. Macroeconomic and financial deve
- Page 32 and 33:
European CommissionThe Second Econo
- Page 34 and 35:
European CommissionThe Second Econo
- Page 36 and 37:
European CommissionThe Second Econo
- Page 38 and 39:
European CommissionThe Second Econo
- Page 40 and 41:
European CommissionThe Second Econo
- Page 42 and 43:
European CommissionThe Second Econo
- Page 44 and 45:
European CommissionThe Second Econo
- Page 46 and 47:
European CommissionThe Second Econo
- Page 48 and 49:
European CommissionThe Second Econo
- Page 50 and 51:
European CommissionThe Second Econo
- Page 52 and 53:
European CommissionThe Second Econo
- Page 54 and 55:
European CommissionThe Second Econo
- Page 56 and 57:
European CommissionThe Second Econo
- Page 58 and 59:
European CommissionThe Second Econo
- Page 60 and 61:
Chart 17Graph 11.1 labour reform in
- Page 62 and 63:
European CommissionThe Second Econo
- Page 64 and 65:
Chart 18Graph 13.1. Distance to Fro
- Page 66 and 67:
European CommissionThe Second Econo
- Page 68 and 69:
European CommissionThe Second Econo
- Page 70 and 71:
European CommissionThe Second Econo
- Page 72 and 73:
European CommissionThe Second Econo
- Page 74 and 75:
European CommissionThe Second Econo
- Page 77 and 78:
4. DEBT SUSTAINABILITY ANALYSIS AND
- Page 79 and 80:
4. Debt sustainability analysis and
- Page 81 and 82:
4. Debt sustainability analysis and
- Page 83:
Table 12. List of Milestones to be
- Page 86 and 87:
European CommissionThe Second Econo
- Page 88 and 89:
European CommissionThe Second Econo
- Page 90 and 91:
European CommissionThe Second Econo
- Page 92 and 93:
European CommissionThe Second Econo
- Page 94 and 95: European CommissionThe Second Econo
- Page 96 and 97: European CommissionThe Second Econo
- Page 98 and 99: European CommissionThe Second Econo
- Page 100 and 101: European CommissionThe Second Econo
- Page 102 and 103: European CommissionThe Second Econo
- Page 104 and 105: European CommissionThe Second Econo
- Page 106 and 107: European CommissionThe Second Econo
- Page 108 and 109: European CommissionThe Second Econo
- Page 110 and 111: European CommissionThe Second Econo
- Page 112 and 113: European CommissionThe Second Econo
- Page 114 and 115: European CommissionThe Second Econo
- Page 116 and 117: European CommissionThe Second Econo
- Page 118 and 119: European CommissionThe Second Econo
- Page 120 and 121: European CommissionThe Second Econo
- Page 122 and 123: European CommissionThe Second Econo
- Page 124 and 125: European CommissionThe Second Econo
- Page 126 and 127: European CommissionThe Second Econo
- Page 128 and 129: European CommissionThe Second Econo
- Page 130 and 131: European CommissionThe Second Econo
- Page 132 and 133: European CommissionThe Second Econo
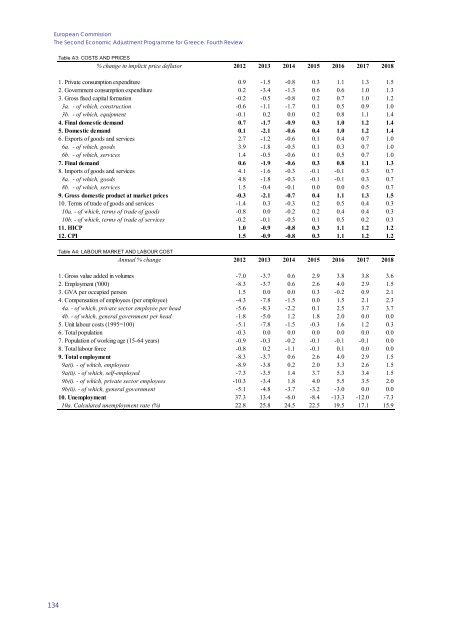
- Page 134 and 135: European CommissionThe Second Econo
- Page 136 and 137: European CommissionThe Second Econo
- Page 138 and 139: European CommissionThe Second Econo
- Page 140 and 141: European CommissionThe Second Econo
- Page 143: ANNEX 2: MACROECONOMIC FORECASTANNE
- Page 147 and 148: ANNEXTable C1: FISCAL ACCOUNTS AND
- Page 149: ANNEX 3: UPDATED PROGRAMME DOCUMENT
- Page 152 and 153: European CommissionThe Second Econo
- Page 154 and 155: European CommissionThe Second Econo
- Page 156 and 157: Memorandum of Understanding on Spec
- Page 158 and 159: Memorandum of Understanding on Spec
- Page 160 and 161: Memorandum of Understanding on Spec
- Page 162 and 163: Memorandum of Understanding on Spec
- Page 164 and 165: Memorandum of Understanding on Spec
- Page 166 and 167: Memorandum of Understanding on Spec
- Page 168 and 169: Memorandum of Understanding on Spec
- Page 170 and 171: Memorandum of Understanding on Spec
- Page 172 and 173: Memorandum of Understanding on Spec
- Page 174 and 175: Memorandum of Understanding on Spec
- Page 176 and 177: Memorandum of Understanding on Spec
- Page 178 and 179: Memorandum of Understanding on Spec
- Page 180 and 181: Memorandum of Understanding on Spec
- Page 182 and 183: Memorandum of Understanding on Spec
- Page 184 and 185: Memorandum of Understanding on Spec
- Page 186 and 187: Memorandum of Understanding on Spec
- Page 188 and 189: Memorandum of Understanding on Spec
- Page 190 and 191: Memorandum of Understanding on Spec
- Page 192 and 193: Memorandum of Understanding on Spec
- Page 194 and 195:
Memorandum of Understanding on Spec
- Page 196 and 197:
Memorandum of Understanding on Spec
- Page 198 and 199:
Memorandum of Understanding on Spec
- Page 200 and 201:
Memorandum of Understanding on Spec
- Page 202 and 203:
Memorandum of Understanding on Spec
- Page 204 and 205:
Memorandum of Understanding on Spec
- Page 206 and 207:
Memorandum of Understanding on Spec
- Page 208 and 209:
Memorandum of Understanding on Spec
- Page 210 and 211:
Memorandum of Understanding on Spec
- Page 212 and 213:
Memorandum of Understanding on Spec
- Page 214 and 215:
Memorandum of Understanding on Spec
- Page 216 and 217:
Memorandum of Understanding on Spec
- Page 218 and 219:
Memorandum of Understanding on Spec
- Page 220 and 221:
Memorandum of Understanding on Spec
- Page 222 and 223:
Memorandum of Understanding on Spec
- Page 224 and 225:
Memorandum of Understanding on Spec
- Page 226 and 227:
Memorandum of Understanding on Spec
- Page 228 and 229:
Memorandum of Understanding on Spec
- Page 230 and 231:
Memorandum of Understanding on Spec
- Page 232 and 233:
Memorandum of Understanding on Spec
- Page 234 and 235:
Memorandum of Understanding on Spec
- Page 236 and 237:
Memorandum of Understanding on Spec
- Page 239 and 240:
OCCASIONAL PAPERSOccasional Papers
- Page 241 and 242:
No. 46No. 47No. 48No. 49The Western
- Page 243 and 244:
No. 80 2011 Pre-accession Economic
- Page 245 and 246:
No. 119No. 120No. 121No. 122Possibl
- Page 247 and 248:
No. 1582013 Economic and Fiscal Pro
- Page 251 and 252:
HOW TO OBTAIN EU PUBLICATIONSFree p