

ocp192_en
ocp192_en
ocp192_en

Create successful ePaper yourself
Turn your PDF publications into a flip-book with our unique Google optimized e-Paper software.
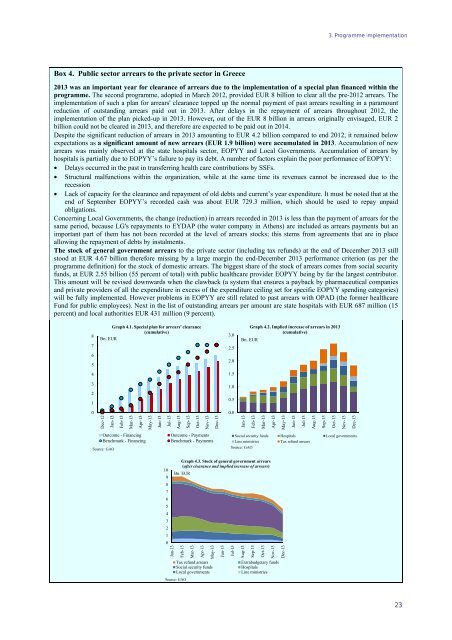
Chart 10 Graph 4.2. Implied increase of arrears in 2013 (cumulative)Chart 11 Graph 4.3. Stock of g<strong>en</strong>eral governm<strong>en</strong>t arrears3. Programme implem<strong>en</strong>tationBox 4. Public sector arrears to the private sector in Greece2013 was an important year for clearance of arrears due to the implem<strong>en</strong>tation of a special plan financed within theprogramme. The second programme, adopted in March 2012, provided EUR 8 billion to clear all the pre-2012 arrears. Theimplem<strong>en</strong>tation of such a plan for arrears' clearance topped up the normal paym<strong>en</strong>t of past arrears resulting in a paramountreduction of outstanding arrears paid out in 2013. After delays in the repaym<strong>en</strong>t of arrears throughout 2012, theimplem<strong>en</strong>tation of the plan picked-up in 2013. However, out of the EUR 8 billion in arrears originally <strong>en</strong>visaged, EUR 2billion could not be cleared in 2013, and therefore are expected to be paid out in 2014.Despite the significant reduction of arrears in 2013 amounting to EUR 4.2 billion compared to <strong>en</strong>d 2012, it remained belowexpectations as a significant amount of new arrears (EUR 1.9 billion) were accumulated in 2013. Accumulation of newarrears was mainly observed at the state hospitals sector, EOPYY and Local Governm<strong>en</strong>ts. Accumulation of arrears byhospitals is partially due to EOPYY’s failure to pay its debt. A number of factors explain the poor performance of EOPYY:• Delays occurred in the past in transferring health care contributions by SSFs.• Structural malfunctions within the organization, while at the same time its rev<strong>en</strong>ues cannot be increased due to therecession• Lack of capacity for the clearance and repaym<strong>en</strong>t of old debts and curr<strong>en</strong>t’s year exp<strong>en</strong>diture. It must be noted that at the<strong>en</strong>d of September EOPYY’s recorded cash was about EUR 729.3 million, which should be used to repay unpaidobligations.Concerning Local Governm<strong>en</strong>ts, the change (reduction) in arrears recorded in 2013 is less than the paym<strong>en</strong>t of arrears for thesame period, because LG's repaym<strong>en</strong>ts to EYDAP (the water company in Ath<strong>en</strong>s) are included as arrears paym<strong>en</strong>ts but animportant part of them has not be<strong>en</strong> recorded at the level of arrears stocks; this stems from agreem<strong>en</strong>ts that are in placeallowing the repaym<strong>en</strong>t of debts by instalm<strong>en</strong>ts.The stock of g<strong>en</strong>eral governm<strong>en</strong>t arrears to the private sector (including tax refunds) at the <strong>en</strong>d of December 2013 stillstood at EUR 4.67 billion therefore missing by a large margin the <strong>en</strong>d-December 2013 performance criterion (as per theprogramme definition) for the stock of domestic arrears. The biggest share of the stock of arrears comes from social securityfunds, at EUR 2.55 billion (55 perc<strong>en</strong>t of total) with public healthcare provider EOPYY being by far the largest contributor.This amount will be revised downwards wh<strong>en</strong> the clawback (a system that <strong>en</strong>sures a payback by pharmaceutical companiesand private providers of all the exp<strong>en</strong>diture in excess of the exp<strong>en</strong>diture ceiling set for specific EOPYY sp<strong>en</strong>ding categories)will be fully implem<strong>en</strong>ted. However problems in EOPYY are still related to past arrears with OPAD (the former healthcareFund for public employees). Next in the list of outstanding arrears per amount are state hospitals with EUR 687 million (15perc<strong>en</strong>t) and local authorities EUR 431 million (9 perc<strong>en</strong>t).hart 9 Graph 4.1. Special plan for arrears' clearance (cumulative)8765Graph 4.1. Special plan for arrears' clearance(cumulative)Bn. EUR3.02.52.0Bn. EURGraph 4.2. Implied increase of arrears in 2013(cumulative)41.53211.00.500.0Dec-12Jan-13Feb-13Mar-13Apr-13May-13Jun-13Jul-13Aug-13Sep-13Oct-13Nov-13Dec-13Jan-13Feb-13Mar-13Apr-13May-13Jun-13Jul-13Aug-13Sep-13Oct-13Nov-13Dec-13Outcome - FinancingB<strong>en</strong>chmark - FinancingSource: GAOOutcome - Paym<strong>en</strong>tsB<strong>en</strong>chmark - Paym<strong>en</strong>tsSocial security funds Hospitals Local governm<strong>en</strong>tsLine ministriesTax refund arrearsSource: GAO109876543210Jan-13Graph 4.3. Stock of g<strong>en</strong>eral governm<strong>en</strong>t arrears(after clearance and implied increase of arrears)Bn. EURFeb-13Mar-13Apr-13May-13Tax refund arrearsSocial security fundsLocal governm<strong>en</strong>tsSource: GAOJun-13Jul-13Aug-13Sep-13Oct-13Nov-13Extrabudgetary fundsHospitalsLine ministriesDec-1323