

ocp192_en
ocp192_en
ocp192_en

You also want an ePaper? Increase the reach of your titles
YUMPU automatically turns print PDFs into web optimized ePapers that Google loves.
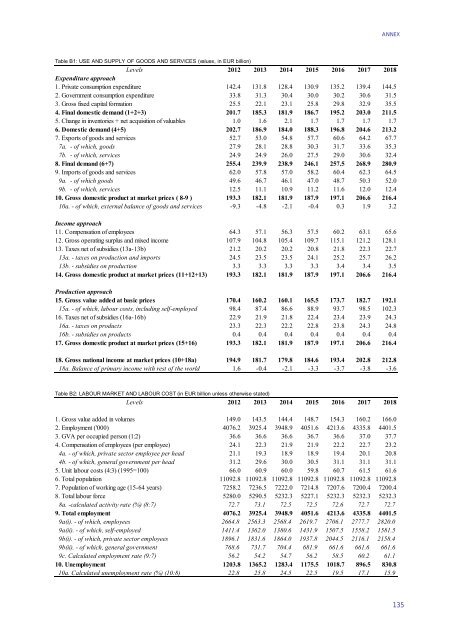
ANNEXTable B1: USE AND SUPPLY OF GOODS AND SERVICES (values, in EUR billion)Levels 2012 2013 2014 2015 2016 2017 2018Exp<strong>en</strong>diture approach1. Private consumption exp<strong>en</strong>diture 142.4 131.8 128.4 130.9 135.2 139.4 144.52. Governm<strong>en</strong>t consumption exp<strong>en</strong>diture 33.8 31.3 30.4 30.0 30.2 30.6 31.53. Gross fixed capital formation 25.5 22.1 23.1 25.8 29.8 32.9 35.54. Final domestic demand (1+2+3) 201.7 185.3 181.9 186.7 195.2 203.0 211.55. Change in inv<strong>en</strong>tories + net acquisition of valuables 1.0 1.6 2.1 1.7 1.7 1.7 1.76. Domestic demand (4+5) 202.7 186.9 184.0 188.3 196.8 204.6 213.27. Exports of goods and services 52.7 53.0 54.8 57.7 60.6 64.2 67.77a. - of which, goods 27.9 28.1 28.8 30.3 31.7 33.6 35.37b. - of which, services 24.9 24.9 26.0 27.5 29.0 30.6 32.48. Final demand (6+7) 255.4 239.9 238.9 246.1 257.5 268.9 280.99. Imports of goods and services 62.0 57.8 57.0 58.2 60.4 62.3 64.59a. - of which goods 49.6 46.7 46.1 47.0 48.7 50.3 52.09b. - of which, services 12.5 11.1 10.9 11.2 11.6 12.0 12.410. Gross domestic product at market prices ( 8-9 ) 193.3 182.1 181.9 187.9 197.1 206.6 216.410a. - of which, external balance of goods and services -9.3 -4.8 -2.1 -0.4 0.3 1.9 3.2Income approach11. Comp<strong>en</strong>sation of employees 64.3 57.1 56.3 57.5 60.2 63.1 65.612. Gross operating surplus and mixed income 107.9 104.8 105.4 109.7 115.1 121.2 128.113. Taxes net of subsidies (13a-13b) 21.2 20.2 20.2 20.8 21.8 22.3 22.713a. - taxes on production and imports 24.5 23.5 23.5 24.1 25.2 25.7 26.213b. - subsidies on production 3.3 3.3 3.3 3.3 3.4 3.4 3.514. Gross domestic product at market prices (11+12+13) 193.3 182.1 181.9 187.9 197.1 206.6 216.4Production approach15. Gross value added at basic prices 170.4 160.2 160.1 165.5 173.7 182.7 192.115a. - of which, labour costs, including self-employed 98.4 87.4 86.6 88.9 93.7 98.5 102.316. Taxes net of subsidies (16a-16b) 22.9 21.9 21.8 22.4 23.4 23.9 24.316a. - taxes on products 23.3 22.3 22.2 22.8 23.8 24.3 24.816b. - subsidies on products 0.4 0.4 0.4 0.4 0.4 0.4 0.417. Gross domestic product at market prices (15+16) 193.3 182.1 181.9 187.9 197.1 206.6 216.418. Gross national income at market prices (10+18a) 194.9 181.7 179.8 184.6 193.4 202.8 212.818a. Balance of primary income with rest of the world 1.6 -0.4 -2.1 -3.3 -3.7 -3.8 -3.6Table B2: LABOUR MARKET AND LABOUR COST (in EUR billion unless otherwise stated)Levels 2012 2013 2014 2015 2016 2017 20181. Gross value added in volumes 149.0 143.5 144.4 148.7 154.3 160.2 166.02. Employm<strong>en</strong>t ('000) 4076.2 3925.4 3948.9 4051.6 4213.6 4335.8 4401.53. GVA per occupied person (1:2) 36.6 36.6 36.6 36.7 36.6 37.0 37.74. Comp<strong>en</strong>sation of employees (per employee) 24.1 22.3 21.9 21.9 22.2 22.7 23.24a. - of which, private sector employee per head 21.1 19.3 18.9 18.9 19.4 20.1 20.84b. - of which, g<strong>en</strong>eral governm<strong>en</strong>t per head 31.2 29.6 30.0 30.5 31.1 31.1 31.15. Unit labour costs (4:3) (1995=100) 66.0 60.9 60.0 59.8 60.7 61.5 61.66. Total population 11092.8 11092.8 11092.8 11092.8 11092.8 11092.8 11092.87. Population of working age (15-64 years) 7258.2 7236.5 7222.0 7214.8 7207.6 7200.4 7200.48. Total labour force 5280.0 5290.5 5232.3 5227.1 5232.3 5232.3 5232.38a. -calculated activity rate (%) (8:7) 72.7 73.1 72.5 72.5 72.6 72.7 72.79. Total employm<strong>en</strong>t 4076.2 3925.4 3948.9 4051.6 4213.6 4335.8 4401.59a(i). - of which, employees 2664.8 2563.3 2568.4 2619.7 2706.1 2777.7 2820.09a(ii). - of which, self-employed 1411.4 1362.0 1380.6 1431.9 1507.5 1558.2 1581.59b(i). - of which, private sector employees 1896.1 1831.6 1864.0 1937.8 2044.5 2116.1 2158.49b(ii). - of which, g<strong>en</strong>eral governm<strong>en</strong>t 768.6 731.7 704.4 681.9 661.6 661.6 661.69c. Calculated employm<strong>en</strong>t rate (9:7) 56.2 54.2 54.7 56.2 58.5 60.2 61.110. Unemploym<strong>en</strong>t 1203.8 1365.2 1283.4 1175.5 1018.7 896.5 830.810a. Calculated unemploym<strong>en</strong>t rate (%) (10:8) 22.8 25.8 24.5 22.5 19.5 17.1 15.9135