

ocp192_en
ocp192_en
ocp192_en

You also want an ePaper? Increase the reach of your titles
YUMPU automatically turns print PDFs into web optimized ePapers that Google loves.
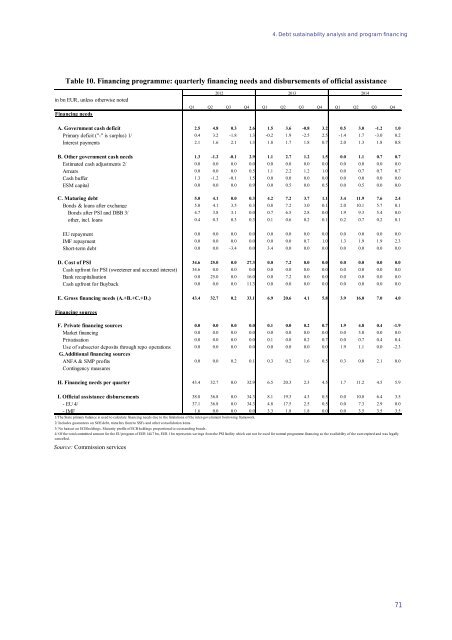
4. Debt sustainability analysis and program financingTable 10. Financing programme: quarterly financing needs and disbursem<strong>en</strong>ts of official assistancein bn EUR, unless otherwise notedFinancing needs2012 2013 2014Q1 Q2 Q3 Q4 Q1 Q2 Q3 Q4 Q1 Q2 Q3 Q4A. Governm<strong>en</strong>t cash deficit 2.5 4.8 0.3 2.6 1.5 3.6 -0.8 3.2 0.5 3.0 -1.2 1.0Primary deficit ("-" is surplus) 1/ 0.4 3.2 -1.8 1.3 -0.2 1.9 -2.5 2.5 -1.4 1.7 -3.0 0.2Interest paym<strong>en</strong>ts 2.1 1.6 2.1 1.3 1.8 1.7 1.8 0.7 2.0 1.3 1.8 0.8B. Other governm<strong>en</strong>t cash needs 1.3 -1.2 -0.1 2.9 1.1 2.7 1.2 1.5 0.0 1.1 0.7 0.7Estimated cash adjustm<strong>en</strong>ts 2/ 0.0 0.0 0.0 0.0 0.0 0.0 0.0 0.0 0.0 0.0 0.0 0.0Arrears 0.0 0.0 0.0 0.5 1.1 2.2 1.2 1.0 0.0 0.7 0.7 0.7Cash buffer 1.3 -1.2 -0.1 1.5 0.0 0.0 0.0 0.0 0.0 0.0 0.0 0.0ESM capital 0.0 0.0 0.0 0.9 0.0 0.5 0.0 0.5 0.0 0.5 0.0 0.0C. Maturing debt 5.0 4.1 0.0 0.3 4.2 7.2 3.7 1.1 3.4 11.9 7.6 2.4Bonds & loans after exchange 5.0 4.1 3.5 0.3 0.8 7.2 3.0 0.1 2.0 10.1 5.7 0.1Bonds after PSI and DBB 3/ 4.7 3.8 3.1 0.0 0.7 6.5 2.8 0.0 1.9 9.3 5.4 0.0other, incl. loans 0.4 0.3 0.3 0.3 0.1 0.6 0.2 0.1 0.2 0.7 0.2 0.1EU repaym<strong>en</strong>t 0.0 0.0 0.0 0.0 0.0 0.0 0.0 0.0 0.0 0.0 0.0 0.0IMF repaym<strong>en</strong>t 0.0 0.0 0.0 0.0 0.0 0.0 0.7 1.0 1.3 1.9 1.9 2.3Short-term debt 0.0 0.0 -3.4 0.0 3.4 0.0 0.0 0.0 0.0 0.0 0.0 0.0D. Cost of PSI 34.6 25.0 0.0 27.3 0.0 7.2 0.0 0.0 0.0 0.0 0.0 0.0Cash upfront for PSI (sweet<strong>en</strong>er and accrued interest) 34.6 0.0 0.0 0.0 0.0 0.0 0.0 0.0 0.0 0.0 0.0 0.0Bank recapitalisation 0.0 25.0 0.0 16.0 0.0 7.2 0.0 0.0 0.0 0.0 0.0 0.0Cash upfront for Buyback 0.0 0.0 0.0 11.3 0.0 0.0 0.0 0.0 0.0 0.0 0.0 0.0E. Gross financing needs (A.+B.+C.+D.) 43.4 32.7 0.2 33.1 6.9 20.6 4.1 5.8 3.9 16.0 7.0 4.0Financing sourcesF. Private financing sources 0.0 0.0 0.0 0.0 0.1 0.0 0.2 0.7 1.9 4.8 0.4 -1.9Market financing 0.0 0.0 0.0 0.0 0.0 0.0 0.0 0.0 0.0 3.0 0.0 0.0Privatisation 0.0 0.0 0.0 0.0 0.1 0.0 0.2 0.7 0.0 0.7 0.4 0.4Use of subsector deposits through repo operations 0.0 0.0 0.0 0.0 0.0 0.0 0.0 0.0 1.9 1.1 0.0 -2.3G.Additional financing sourcesANFA & SMP profits 0.0 0.0 0.2 0.1 0.3 0.2 1.6 0.5 0.3 0.0 2.1 0.0Conting<strong>en</strong>cy measuresH. Financing needs per quarter 43.4 32.7 0.0 32.9 6.5 20.3 2.3 4.5 1.7 11.2 4.5 5.9I. Official assistance disbursem<strong>en</strong>ts 38.8 36.8 0.0 34.3 8.1 19.3 4.3 0.5 0.0 10.8 6.4 3.5- EU 4/ 37.1 36.8 0.0 34.3 4.8 17.5 2.5 0.5 0.0 7.3 2.9 0.0- IMF 1.6 0.0 0.0 0.0 3.3 1.8 1.8 0.0 0.0 3.5 3.5 3.51/The State primary balance is used to calculate financing needs due to the limitations of the inter-governm<strong>en</strong>t borrowing framework.2/ Includes guarantees on SOE debt, transfers from/to SSFs and other consolidation items.3/ No haircut on ECB holdings. Maturity profile of ECB holdings proportional to outstanding bonds.4/ Of the total committed amount for the EU program of EUR 144.7 bn, EUR 1 bn repres<strong>en</strong>ts savings from the PSI facility which can not be used for normal programme financing as the availability of the sum expired and was legallycancelled.Source: Commission services71