

ocp192_en
ocp192_en
ocp192_en

You also want an ePaper? Increase the reach of your titles
YUMPU automatically turns print PDFs into web optimized ePapers that Google loves.
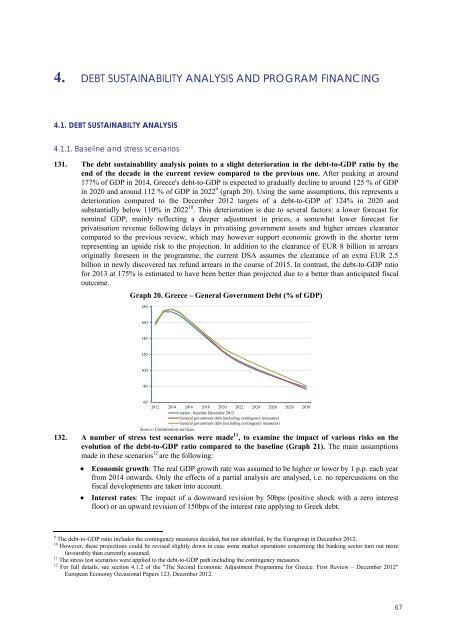
4. DEBT SUSTAINABILITY ANALYSIS AND PROGRAMME FINANCING4. DEBT SUSTAINABILITY ANALYSIS AND PROGRAM FINANCING4.1. DEBT SUSTAINABILTY ANALYSIS4.1.1. Baseline and stress sc<strong>en</strong>arios131. The debt sustainability analysis points to a slight deterioration in the debt-to-GDP ratio by the<strong>en</strong>d of the decade in the curr<strong>en</strong>t review compared to the previous one. After peaking at around177% of GDP in 2014, Greece's debt-to-GDP is expected to gradually decline to around 125 % of GDPin 2020 and around 112 % of GDP in 2022 9 (graph 20). Using the same assumptions, this repres<strong>en</strong>ts adeterioration compared to the December 2012 targets of a debt-to-GDP of 124% in 2020 andsubstantially below 110% in 2022 10 . This deterioration is due to several factors: a lower forecast fornominal GDP, mainly reflecting a deeper adjustm<strong>en</strong>t in prices, a somewhat lower forecast forprivatisation rev<strong>en</strong>ue following delays in privatising governm<strong>en</strong>t assets and higher arrears clearancecompared to the previous review, which may however support economic growth in the shorter termrepres<strong>en</strong>ting an upside risk to the projection. In addition to the clearance of EUR 8 billion in arrearsoriginally forese<strong>en</strong> in the programme, the curr<strong>en</strong>t DSA assumes the clearance of an extra EUR 2.5billion in newly discovered tax refund arrears in the course of 2015. In contrast, the debt-to-GDP ratiofor 2013 at 175% is estimated to have be<strong>en</strong> better than projected due to a better than anticipated fiscaloutcome.Graph 20. Greece – G<strong>en</strong>eral Governm<strong>en</strong>t Debt (% of GDP)18016014012010080602012 2014 2016 2018 2020 2022 2024 2026 2028 2030memo : baseline December 2012G<strong>en</strong>eral governm<strong>en</strong>t debt (including conting<strong>en</strong>cy measures)G<strong>en</strong>eral governm<strong>en</strong>t debt (excluding conting<strong>en</strong>cy measures)Source: Commission services.132. A number of stress test sc<strong>en</strong>arios were made 11 , to examine the impact of various risks on theevolution of the debt-to-GDP ratio compared to the baseline (Graph 21). The main assumptionsmade in these sc<strong>en</strong>arios 12 are the following:• Economic growth: The real GDP growth rate was assumed to be higher or lower by 1 p.p. each yearfrom 2014 onwards. Only the effects of a partial analysis are analysed, i.e. no repercussions on thefiscal developm<strong>en</strong>ts are tak<strong>en</strong> into account.• Interest rates: The impact of a downward revision by 50bps (positive shock with a zero interestfloor) or an upward revision of 150bps of the interest rate applying to Greek debt.9 The debt-to-GDP ratio includes the conting<strong>en</strong>cy measures decided, but not id<strong>en</strong>tified, by the Eurogroup in December 2012.10 However, these projections could be revised slightly down in case some market operations concerning the banking sector turn out morefavourably than curr<strong>en</strong>tly assumed.11 The stress test sc<strong>en</strong>arios were applied to the debt-to-GDP path including the conting<strong>en</strong>cy measures.12 For full details, see section 4.1.2 of the "The Second Economic Adjustm<strong>en</strong>t Programme for Greece: First Review – December 2012"European Economy Occasional Papers 123, December 2012.67