ocp192_en
ocp192_en
ocp192_en
You also want an ePaper? Increase the reach of your titles
YUMPU automatically turns print PDFs into web optimized ePapers that Google loves.
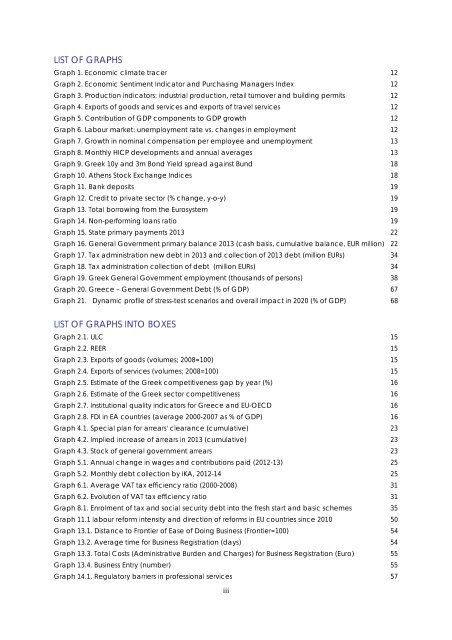
LIST OF GRAPHSGraph 1. Economic climate tracer 12Graph 2. Economic S<strong>en</strong>tim<strong>en</strong>t Indicator and Purchasing Managers Index 12Graph 3. Production indicators: industrial production, retail turnover and building permits 12Graph 4. Exports of goods and services and exports of travel services 12Graph 5. Contribution of GDP compon<strong>en</strong>ts to GDP growth 12Graph 6. Labour market: unemploym<strong>en</strong>t rate vs. changes in employm<strong>en</strong>t 12Graph 7. Growth in nominal comp<strong>en</strong>sation per employee and unemploym<strong>en</strong>t 13Graph 8. Monthly HICP developm<strong>en</strong>ts and annual averages 13Graph 9. Greek 10y and 3m Bond Yield spread against Bund 18Graph 10. Ath<strong>en</strong>s Stock Exchange Indices 18Graph 11. Bank deposits 19Graph 12. Credit to private sector (% change, y-o-y) 19Graph 13. Total borrowing from the Eurosystem 19Graph 14. Non-performing loans ratio 19Graph 15. State primary paym<strong>en</strong>ts 2013 22Graph 16. G<strong>en</strong>eral Governm<strong>en</strong>t primary balance 2013 (cash basis, cumulative balance, EUR million) 22Graph 17. Tax administration new debt in 2013 and collection of 2013 debt (million EURs) 34Graph 18. Tax administration collection of debt (million EURs) 34Graph 19. Greek G<strong>en</strong>eral Governm<strong>en</strong>t employm<strong>en</strong>t (thousands of persons) 38Graph 20. Greece – G<strong>en</strong>eral Governm<strong>en</strong>t Debt (% of GDP) 67Graph 21. Dynamic profile of stress-test sc<strong>en</strong>arios and overall impact in 2020 (% of GDP) 68LIST OF GRAPHS INTO BOXESGraph 2.1. ULC 15Graph 2.2. REER 15Graph 2.3. Exports of goods (volumes; 2008=100) 15Graph 2.4. Exports of services (volumes; 2008=100) 15Graph 2.5. Estimate of the Greek competitiv<strong>en</strong>ess gap by year (%) 16Graph 2.6. Estimate of the Greek sector competitiv<strong>en</strong>ess 16Graph 2.7. Institutional quality indicators for Greece and EU-OECD 16Graph 2.8. FDI in EA countries (average 2000-2007 as % of GDP) 16Graph 4.1. Special plan for arrears' clearance (cumulative) 23Graph 4.2. Implied increase of arrears in 2013 (cumulative) 23Graph 4.3. Stock of g<strong>en</strong>eral governm<strong>en</strong>t arrears 23Graph 5.1. Annual change in wages and contributions paid (2012-13) 25Graph 5.2. Monthly debt collection by IKA, 2012-14 25Graph 6.1. Average VAT tax effici<strong>en</strong>cy ratio (2000-2008) 31Graph 6.2. Evolution of VAT tax effici<strong>en</strong>cy ratio 31Graph 8.1. Enrolm<strong>en</strong>t of tax and social security debt into the fresh start and basic schemes 35Graph 11.1 labour reform int<strong>en</strong>sity and direction of reforms in EU countries since 2010 50Graph 13.1. Distance to Frontier of Ease of Doing Business (Frontier=100) 54Graph 13.2. Average time for Business Registration (days) 54Graph 13.3. Total Costs (Administrative Burd<strong>en</strong> and Charges) for Business Registration (Euro) 55Graph 13.4. Business Entry (number) 55Graph 14.1. Regulatory barriers in professional services 57iii


