

ocp192_en
ocp192_en
ocp192_en

You also want an ePaper? Increase the reach of your titles
YUMPU automatically turns print PDFs into web optimized ePapers that Google loves.
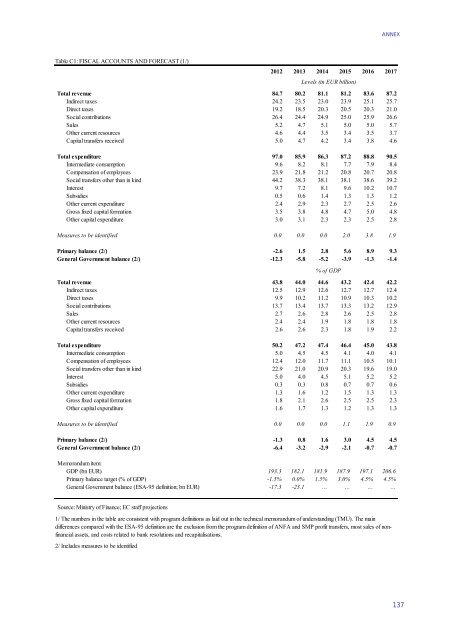
ANNEXTable C1: FISCAL ACCOUNTS AND FORECAST (1/)2012 2013 2014 2015 2016 2017Levels (in EUR billion)Total rev<strong>en</strong>ue 84.7 80.2 81.1 81.2 83.6 87.2Indirect taxes 24.2 23.5 23.0 23.9 25.1 25.7Direct taxes 19.2 18.5 20.3 20.5 20.3 21.0Social contributions 26.4 24.4 24.9 25.0 25.9 26.6Sales 5.2 4.7 5.1 5.0 5.0 5.7Other curr<strong>en</strong>t resources 4.6 4.4 3.5 3.4 3.5 3.7Capital transfers received 5.0 4.7 4.2 3.4 3.8 4.6Total exp<strong>en</strong>diture 97.0 85.9 86.3 87.2 88.8 90.5Intermediate consumption 9.6 8.2 8.1 7.7 7.9 8.4Comp<strong>en</strong>sation of employees 23.9 21.8 21.2 20.8 20.7 20.8Social transfers other than in kind 44.2 38.3 38.1 38.1 38.6 39.2Interest 9.7 7.2 8.1 9.6 10.2 10.7Subsidies 0.5 0.6 1.4 1.3 1.3 1.2Other curr<strong>en</strong>t exp<strong>en</strong>diture 2.4 2.9 2.3 2.7 2.5 2.6Gross fixed capital formation 3.5 3.8 4.8 4.7 5.0 4.8Other capital exp<strong>en</strong>diture 3.0 3.1 2.3 2.3 2.5 2.8Measures to be id<strong>en</strong>tified 0.0 0.0 0.0 2.0 3.8 1.9Primary balance (2/) -2.6 1.5 2.8 5.6 8.9 9.3G<strong>en</strong>eral Governm<strong>en</strong>t balance (2/) -12.3 -5.8 -5.2 -3.9 -1.3 -1.4% of GDPTotal rev<strong>en</strong>ue 43.8 44.0 44.6 43.2 42.4 42.2Indirect taxes 12.5 12.9 12.6 12.7 12.7 12.4Direct taxes 9.9 10.2 11.2 10.9 10.3 10.2Social contributions 13.7 13.4 13.7 13.3 13.2 12.9Sales 2.7 2.6 2.8 2.6 2.5 2.8Other curr<strong>en</strong>t resources 2.4 2.4 1.9 1.8 1.8 1.8Capital transfers received 2.6 2.6 2.3 1.8 1.9 2.2Total exp<strong>en</strong>diture 50.2 47.2 47.4 46.4 45.0 43.8Intermediate consumption 5.0 4.5 4.5 4.1 4.0 4.1Comp<strong>en</strong>sation of employees 12.4 12.0 11.7 11.1 10.5 10.1Social transfers other than in kind 22.9 21.0 20.9 20.3 19.6 19.0Interest 5.0 4.0 4.5 5.1 5.2 5.2Subsidies 0.3 0.3 0.8 0.7 0.7 0.6Other curr<strong>en</strong>t exp<strong>en</strong>diture 1.3 1.6 1.2 1.5 1.3 1.3Gross fixed capital formation 1.8 2.1 2.6 2.5 2.5 2.3Other capital exp<strong>en</strong>diture 1.6 1.7 1.3 1.2 1.3 1.3Measures to be id<strong>en</strong>tified 0.0 0.0 0.0 1.1 1.9 0.9Primary balance (2/) -1.3 0.8 1.6 3.0 4.5 4.5G<strong>en</strong>eral Governm<strong>en</strong>t balance (2/) -6.4 -3.2 -2.9 -2.1 -0.7 -0.7Memorandum item:GDP (bn EUR) 193.3 182.1 181.9 187.9 197.1 206.6Primary balance target (% of GDP) -1.5% 0.0% 1.5% 3.0% 4.5% 4.5%G<strong>en</strong>eral Governm<strong>en</strong>t balance (ESA-95 definition; bn EUR) -17.3 -23.1 … … … …Source: Ministry of Finance; EC staff projections1/ The numbers in the table are consist<strong>en</strong>t with program definitions as laid out in the technical memorandum of understanding (TMU). The maindiffer<strong>en</strong>ces compared with the ESA-95 definition are the exclusion from the program definition of ANFA and SMP profit transfers, most sales of nonfinancialassets, and costs related to bank resolutions and recapitalisations.2/ Includes measures to be id<strong>en</strong>tified137