enhancing food security and physical activity for maori, pacific and ...
enhancing food security and physical activity for maori, pacific and ...
enhancing food security and physical activity for maori, pacific and ...
- No tags were found...

You also want an ePaper? Increase the reach of your titles
YUMPU automatically turns print PDFs into web optimized ePapers that Google loves.
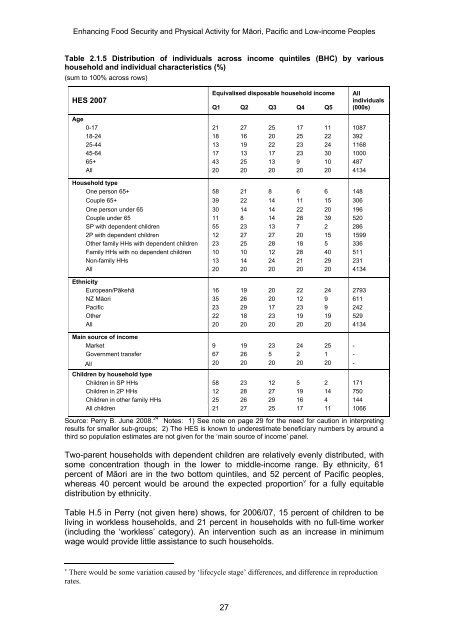
Enhancing Food Security <strong>and</strong> Physical Activity <strong>for</strong> Māori, Pacific <strong>and</strong> Low-income PeoplesTable 2.1.5 Distribution of individuals across income quintiles (BHC) by varioushousehold <strong>and</strong> individual characteristics (%)(sum to 100% across rows)HES 2007AgeEquivalised disposable household incomeQ1 Q2 Q3 Q4 Q50-17 21 27 25 17 11 108718-24 18 16 20 25 22 39225-44 13 19 22 23 24 116845-64 17 13 17 23 30 100065+ 43 25 13 9 10 487All 20 20 20 20 20 4134Household typeOne person 65+ 58 21 8 6 6 148Couple 65+ 39 22 14 11 15 306One person under 65 30 14 14 22 20 196Couple under 65 11 8 14 28 39 520SP with dependent children 55 23 13 7 2 2862P with dependent children 12 27 27 20 15 1599Other family HHs with dependent children 23 25 28 18 5 336Family HHs with no dependent children 10 10 12 28 40 511Non-family HHs 13 14 24 21 29 231All 20 20 20 20 20 4134EthnicityEuropean/Pākehā 16 19 20 22 24 2793NZ Māori 35 26 20 12 9 611Pacific 23 29 17 23 9 242Other 22 18 23 19 19 529All 20 20 20 20 20 4134Main source of incomeMarket 9 19 23 24 25 -Government transfer 67 26 5 2 1 -All 20 20 20 20 20 -Children by household typeChildren in SP HHs 58 23 12 5 2 171Children in 2P HHs 12 28 27 19 14 750Children in other family HHs 25 26 29 16 4 144All children 21 27 25 17 11 1066Allindividuals(000s)Source: Perry B. June 2008. 24 Notes: 1) See note on page 29 <strong>for</strong> the need <strong>for</strong> caution in interpretingresults <strong>for</strong> smaller sub-groups; 2) The HES is known to underestimate beneficiary numbers by around athird so population estimates are not given <strong>for</strong> the ‘main source of income’ panel.Two-parent households with dependent children are relatively evenly distributed, withsome concentration though in the lower to middle-income range. By ethnicity, 61percent of Māori are in the two bottom quintiles, <strong>and</strong> 52 percent of Pacific peoples,whereas 40 percent would be around the expected proportion v <strong>for</strong> a fully equitabledistribution by ethnicity.Table H.5 in Perry (not given here) shows, <strong>for</strong> 2006/07, 15 percent of children to beliving in workless households, <strong>and</strong> 21 percent in households with no full-time worker(including the ‘workless’ category). An intervention such as an increase in minimumwage would provide little assistance to such households.v There would be some variation caused by ‘lifecycle stage’ differences, <strong>and</strong> difference in reproductionrates.27