Prepared by: Dr. Musa Ajlouni January, 2010 - World Health ...
Prepared by: Dr. Musa Ajlouni January, 2010 - World Health ...
Prepared by: Dr. Musa Ajlouni January, 2010 - World Health ...

Create successful ePaper yourself
Turn your PDF publications into a flip-book with our unique Google optimized e-Paper software.
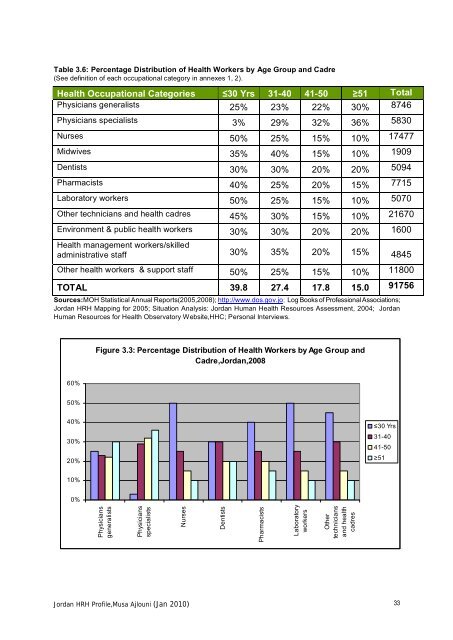
Table 3.6: Percentage Distribution of <strong>Health</strong> Workers <strong>by</strong> Age Group and Cadre(See definition of each occupational category in annexes 1, 2).<strong>Health</strong> Occupational Categories ≤30 Yrs 31-40 41-50 ≥51 TotalPhysicians generalists 25% 23% 22% 30% 8746Physicians specialists 3% 29% 32% 36% 5830Nurses 50% 25% 15% 10% 17477Midwives 35% 40% 15% 10% 1909Dentists 30% 30% 20% 20% 5094Pharmacists 40% 25% 20% 15% 7715Laboratory workers 50% 25% 15% 10% 5070Other technicians and health cadres 45% 30% 15% 10% 21670Environment & public health workers 30% 30% 20% 20% 1600<strong>Health</strong> management workers/skilledadministrative staff 30% 35% 20% 15% 4845Other health workers & support staff 50% 25% 15% 10% 11800TOTAL 39.8 27.4 17.8 15.0 91756Sources:MOH Statistical Annual Reports(2005,2008); http://www.dos.gov.jo; Log Books of Professional Associations;Jordan HRH Mapping for 2005; Situation Analysis: Jordan Human <strong>Health</strong> Resources Assessment, 2004; JordanHuman Resources for <strong>Health</strong> Observatory Website,HHC; Personal Interviews.Figure 3.3: Percentage Distribution of <strong>Health</strong> Workers <strong>by</strong> Age Group andCadre,Jordan,200860%50%40%Figure 0.3: Percentage Distribution of <strong>Health</strong> Workers <strong>by</strong> Age Group and Cadre, Jordan, 2008.30%20%≤30 Yrs31-4041-50≥5110%0%PhysiciansgeneralistsPhysiciansspecialistsNursesDentistsPharmacistsLaboratoryworkersOthertechniciansand healthcadresJordan HRH Profile,<strong>Musa</strong> <strong>Ajlouni</strong> (Jan <strong>2010</strong>) 33