ACTIVITY MONITOR - Vanderbilt Kennedy Center
ACTIVITY MONITOR - Vanderbilt Kennedy Center
ACTIVITY MONITOR - Vanderbilt Kennedy Center

You also want an ePaper? Increase the reach of your titles
YUMPU automatically turns print PDFs into web optimized ePapers that Google loves.
MED ASSOCIATES INC. <strong>ACTIVITY</strong> <strong>MONITOR</strong><br />
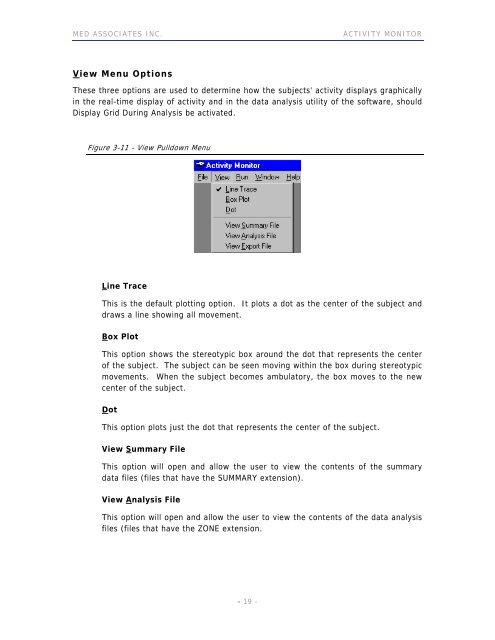
View Menu Options<br />
These three options are used to determine how the subjects' activity displays graphically<br />
in the real-time display of activity and in the data analysis utility of the software, should<br />
Display Grid During Analysis be activated.<br />
Figure 3-11 - View Pulldown Menu<br />
Line Trace<br />
This is the default plotting option. It plots a dot as the center of the subject and<br />
draws a line showing all movement.<br />
Box Plot<br />
This option shows the stereotypic box around the dot that represents the center<br />
of the subject. The subject can be seen moving within the box during stereotypic<br />
movements. When the subject becomes ambulatory, the box moves to the new<br />
center of the subject.<br />
Dot<br />
This option plots just the dot that represents the center of the subject.<br />
View Summary File<br />
This option will open and allow the user to view the contents of the summary<br />
data files (files that have the SUMMARY extension).<br />
View Analysis File<br />
This option will open and allow the user to view the contents of the data analysis<br />
files (files that have the ZONE extension.<br />
- 19 -