ACTIVITY MONITOR - Vanderbilt Kennedy Center
ACTIVITY MONITOR - Vanderbilt Kennedy Center
ACTIVITY MONITOR - Vanderbilt Kennedy Center

Create successful ePaper yourself
Turn your PDF publications into a flip-book with our unique Google optimized e-Paper software.
MED ASSOCIATES INC. <strong>ACTIVITY</strong> <strong>MONITOR</strong><br />
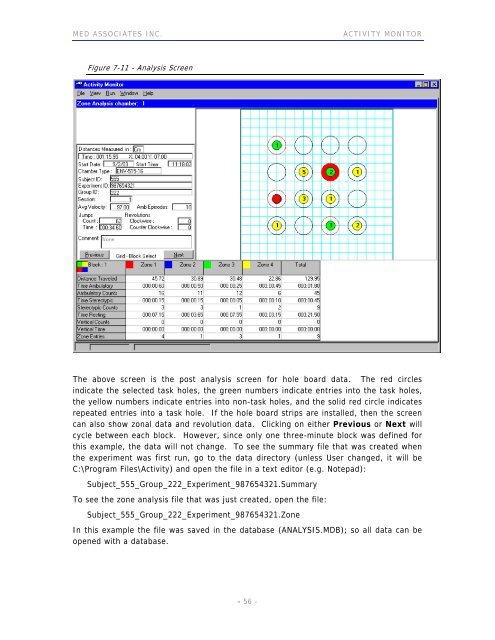
Figure 7-11 - Analysis Screen<br />
The above screen is the post analysis screen for hole board data. The red circles<br />
indicate the selected task holes, the green numbers indicate entries into the task holes,<br />
the yellow numbers indicate entries into non-task holes, and the solid red circle indicates<br />
repeated entries into a task hole. If the hole board strips are installed, then the screen<br />
can also show zonal data and revolution data. Clicking on either Previous or Next will<br />
cycle between each block. However, since only one three-minute block was defined for<br />
this example, the data will not change. To see the summary file that was created when<br />
the experiment was first run, go to the data directory (unless User changed, it will be<br />
C:\Program Files\Activity) and open the file in a text editor (e.g. Notepad):<br />
Subject_555_Group_222_Experiment_987654321.Summary<br />
To see the zone analysis file that was just created, open the file:<br />
Subject_555_Group_222_Experiment_987654321.Zone<br />
In this example the file was saved in the database (ANALYSIS.MDB); so all data can be<br />
opened with a database.<br />
- 56 -