ACTIVITY MONITOR - Vanderbilt Kennedy Center
ACTIVITY MONITOR - Vanderbilt Kennedy Center
ACTIVITY MONITOR - Vanderbilt Kennedy Center

You also want an ePaper? Increase the reach of your titles
YUMPU automatically turns print PDFs into web optimized ePapers that Google loves.
MED ASSOCIATES INC. <strong>ACTIVITY</strong> <strong>MONITOR</strong><br />
CHAPTER 4<br />
Data Analysis Menu Options<br />
Data Analysis Setup<br />
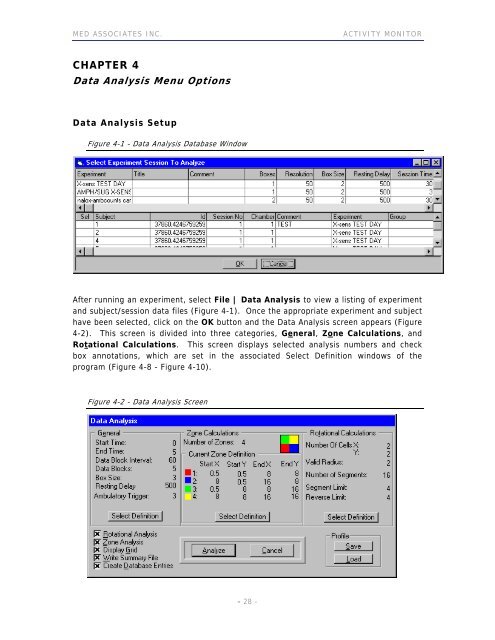
Figure 4-1 - Data Analysis Database Window<br />
After running an experiment, select File | Data Analysis to view a listing of experiment<br />
and subject/session data files (Figure 4-1). Once the appropriate experiment and subject<br />
have been selected, click on the OK button and the Data Analysis screen appears (Figure<br />
4-2). This screen is divided into three categories, General, Zone Calculations, and<br />
Rotational Calculations. This screen displays selected analysis numbers and check<br />
box annotations, which are set in the associated Select Definition windows of the<br />
program (Figure 4-8 - Figure 4-10).<br />
Figure 4-2 - Data Analysis Screen<br />
- 28 -