ACTIVITY MONITOR - Vanderbilt Kennedy Center
ACTIVITY MONITOR - Vanderbilt Kennedy Center
ACTIVITY MONITOR - Vanderbilt Kennedy Center

You also want an ePaper? Increase the reach of your titles
YUMPU automatically turns print PDFs into web optimized ePapers that Google loves.
MED ASSOCIATES INC. <strong>ACTIVITY</strong> <strong>MONITOR</strong><br />
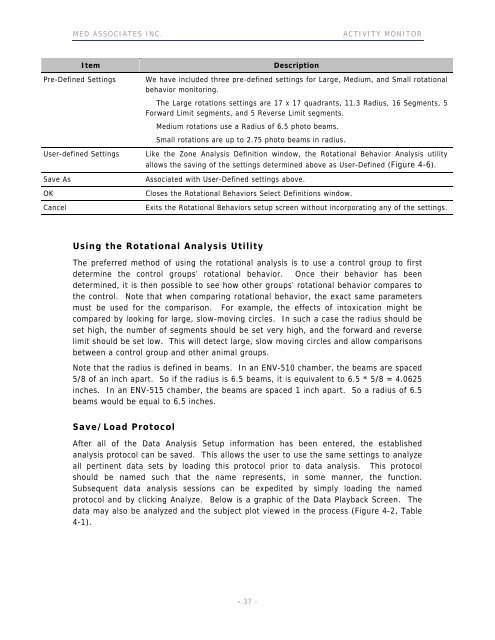
Item Description<br />
Pre-Defined Settings We have included three pre-defined settings for Large, Medium, and Small rotational<br />
behavior monitoring.<br />
The Large rotations settings are 17 x 17 quadrants, 11.3 Radius, 16 Segments, 5<br />
Forward Limit segments, and 5 Reverse Limit segments.<br />
Medium rotations use a Radius of 6.5 photo beams.<br />
Small rotations are up to 2.75 photo beams in radius.<br />
User-defined Settings Like the Zone Analysis Definition window, the Rotational Behavior Analysis utility<br />
allows the saving of the settings determined above as User-Defined (Figure 4-6).<br />
Save As Associated with User-Defined settings above.<br />
OK Closes the Rotational Behaviors Select Definitions window.<br />
Cancel Exits the Rotational Behaviors setup screen without incorporating any of the settings.<br />
Using the Rotational Analysis Utility<br />
The preferred method of using the rotational analysis is to use a control group to first<br />
determine the control groups’ rotational behavior. Once their behavior has been<br />
determined, it is then possible to see how other groups’ rotational behavior compares to<br />
the control. Note that when comparing rotational behavior, the exact same parameters<br />
must be used for the comparison. For example, the effects of intoxication might be<br />
compared by looking for large, slow-moving circles. In such a case the radius should be<br />
set high, the number of segments should be set very high, and the forward and reverse<br />
limit should be set low. This will detect large, slow moving circles and allow comparisons<br />
between a control group and other animal groups.<br />
Note that the radius is defined in beams. In an ENV-510 chamber, the beams are spaced<br />
5/8 of an inch apart. So if the radius is 6.5 beams, it is equivalent to 6.5 * 5/8 = 4.0625<br />
inches. In an ENV-515 chamber, the beams are spaced 1 inch apart. So a radius of 6.5<br />
beams would be equal to 6.5 inches.<br />
Save/Load Protocol<br />
After all of the Data Analysis Setup information has been entered, the established<br />
analysis protocol can be saved. This allows the user to use the same settings to analyze<br />
all pertinent data sets by loading this protocol prior to data analysis. This protocol<br />
should be named such that the name represents, in some manner, the function.<br />
Subsequent data analysis sessions can be expedited by simply loading the named<br />
protocol and by clicking Analyze. Below is a graphic of the Data Playback Screen. The<br />
data may also be analyzed and the subject plot viewed in the process (Figure 4-2, Table<br />
4-1).<br />
- 37 -