ACTIVITY MONITOR - Vanderbilt Kennedy Center
ACTIVITY MONITOR - Vanderbilt Kennedy Center
ACTIVITY MONITOR - Vanderbilt Kennedy Center

You also want an ePaper? Increase the reach of your titles
YUMPU automatically turns print PDFs into web optimized ePapers that Google loves.
MED ASSOCIATES INC. <strong>ACTIVITY</strong> <strong>MONITOR</strong><br />
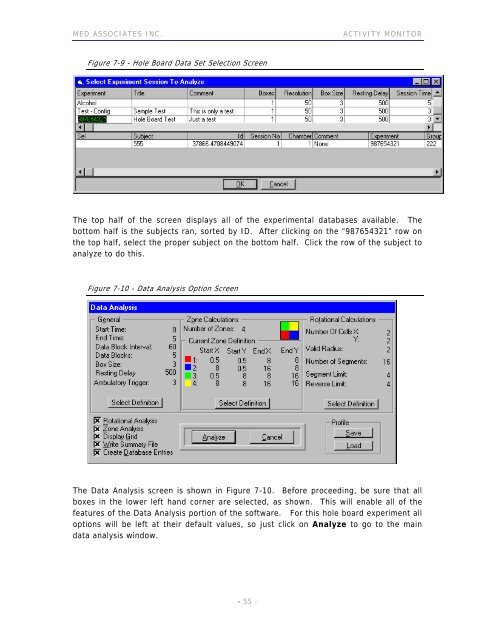
Figure 7-9 - Hole Board Data Set Selection Screen<br />
The top half of the screen displays all of the experimental databases available. The<br />
bottom half is the subjects ran, sorted by ID. After clicking on the “987654321” row on<br />
the top half, select the proper subject on the bottom half. Click the row of the subject to<br />
analyze to do this.<br />
Figure 7-10 - Data Analysis Option Screen<br />
The Data Analysis screen is shown in Figure 7-10. Before proceeding, be sure that all<br />
boxes in the lower left hand corner are selected, as shown. This will enable all of the<br />
features of the Data Analysis portion of the software. For this hole board experiment all<br />
options will be left at their default values, so just click on Analyze to go to the main<br />
data analysis window.<br />
- 55 -