ACTIVITY MONITOR - Vanderbilt Kennedy Center
ACTIVITY MONITOR - Vanderbilt Kennedy Center
ACTIVITY MONITOR - Vanderbilt Kennedy Center

You also want an ePaper? Increase the reach of your titles
YUMPU automatically turns print PDFs into web optimized ePapers that Google loves.
MED ASSOCIATES INC. <strong>ACTIVITY</strong> <strong>MONITOR</strong><br />
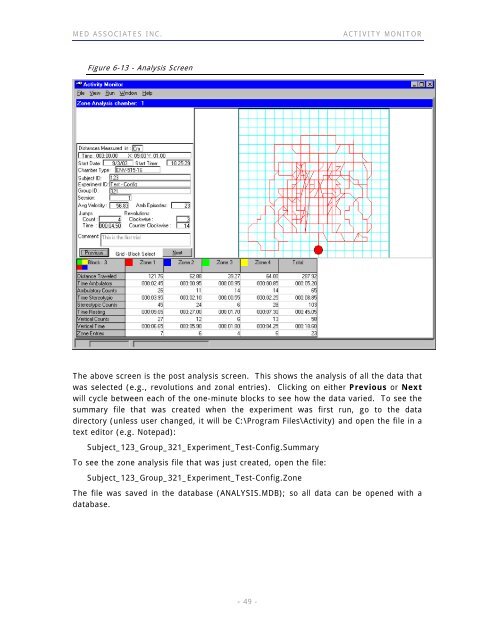
Figure 6-13 - Analysis Screen<br />
The above screen is the post analysis screen. This shows the analysis of all the data that<br />
was selected (e.g., revolutions and zonal entries). Clicking on either Previous or Next<br />
will cycle between each of the one-minute blocks to see how the data varied. To see the<br />
summary file that was created when the experiment was first run, go to the data<br />
directory (unless user changed, it will be C:\Program Files\Activity) and open the file in a<br />
text editor (e.g. Notepad):<br />
Subject_123_Group_321_Experiment_Test-Config.Summary<br />
To see the zone analysis file that was just created, open the file:<br />
Subject_123_Group_321_Experiment_Test-Config.Zone<br />
The file was saved in the database (ANALYSIS.MDB); so all data can be opened with a<br />
database.<br />
- 49 -