

TDC Group Annual Report 2011(6,4MB) - TDC Annual Report 2011
TDC Group Annual Report 2011(6,4MB) - TDC Annual Report 2011
TDC Group Annual Report 2011(6,4MB) - TDC Annual Report 2011

You also want an ePaper? Increase the reach of your titles
YUMPU automatically turns print PDFs into web optimized ePapers that Google loves.
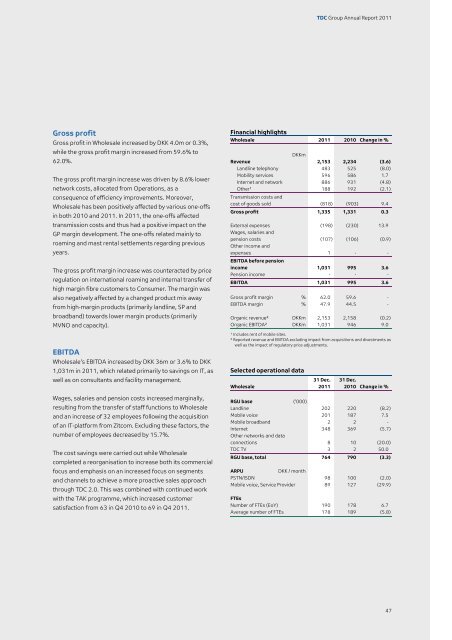
Gross profit<br />
Gross profit in Wholesale increased by DKK 4.0m or 0.3%,<br />
while the gross profit margin increased from 59.6% to<br />
62.0%.<br />
The gross profit margin increase was driven by 8.6% lower<br />
network costs, allocated from Operations, as a<br />
consequence of efficiency improvements. Moreover,<br />
Wholesale has been positively affected by various one-offs<br />
in both 2010 and <strong>2011</strong>. In <strong>2011</strong>, the one-offs affected<br />
transmission costs and thus had a positive impact on the<br />
GP margin development. The one-offs related mainly to<br />
roaming and mast rental settlements regarding previous<br />
years.<br />
The gross profit margin increase was counteracted by price<br />
regulation on international roaming and internal transfer of<br />
high margin fibre customers to Consumer. The margin was<br />
also negatively affected by a changed product mix away<br />
from high-margin products (primarily landline, SP and<br />
broadband) towards lower margin products (primarily<br />
MVNO and capacity).<br />
EBITDA<br />
Wholesale's EBITDA increased by DKK 36m or 3.6% to DKK<br />
1,031m in <strong>2011</strong>, which related primarily to savings on IT, as<br />
well as on consultants and facility management.<br />
Wages, salaries and pension costs increased marginally,<br />
resulting from the transfer of staff functions to Wholesale<br />
and an increase of 32 employees following the acquisition<br />
of an IT-platform from Zitcom. Excluding these factors, the<br />
number of employees decreased by 15.7%.<br />
The cost savings were carried out while Wholesale<br />
completed a reorganisation to increase both its commercial<br />
focus and emphasis on an increased focus on segments<br />
and channels to achieve a more proactive sales approach<br />
through <strong>TDC</strong> 2.0. This was combined with continued work<br />
with the TAK programme, which increased customer<br />
satisfaction from 63 in Q4 2010 to 69 in Q4 <strong>2011</strong>.<br />
<strong>TDC</strong> <strong>Group</strong> <strong>Annual</strong> <strong>Report</strong> <strong>2011</strong><br />
Financial highlights<br />
Wholesale <strong>2011</strong> 2010 Change in %<br />
DKKm<br />
Revenue 2,153 2,234 (3.6)<br />
Landline telephony 483 525 (8.0)<br />
Mobility services 596 586 1.7<br />
Internet and network 886 931 (4.8)<br />
Other¹<br />
Transmission costs and<br />
188 192 (2.1)<br />
cost of goods sold (818) (903) 9.4<br />
Gross profit 1,335 1,331 0.3<br />
External expenses<br />
Wages, salaries and<br />
(198) (230) 13.9<br />
pension costs<br />
Other income and<br />
(107) (106) (0.9)<br />
expenses<br />
EBITDA before pension<br />
1 - -<br />
income 1,031 995 3.6<br />
Pension income - - -<br />
EBITDA 1,031 995 3.6<br />
Gross profit margin % 62.0 59.6 -<br />
EBITDA margin % 47.9 44.5 -<br />
Organic revenue² DKKm 2,153 2,158 (0.2)<br />
Organic EBITDA² DKKm 1,031 946 9.0<br />
¹ Includes rent of mobile sites.<br />
² <strong>Report</strong>ed revenue and EBITDA excluding impact from acquisitions and divestments as<br />
well as the impact of regulatory price adjustments.<br />
Selected operational data<br />
Wholesale<br />
31 Dec.<br />
<strong>2011</strong><br />
31 Dec.<br />
2010 Change in %<br />
RGU base ('000)<br />
Landline 202 220 (8.2)<br />
Mobile voice 201 187 7.5<br />
Mobile broadband 2 2 -<br />
Internet<br />
Other networks and data<br />
348 369 (5.7)<br />
connections 8 10 (20.0)<br />
<strong>TDC</strong> TV 3 2 50.0<br />
RGU base, total 764 790 (3.3)<br />
ARPU DKK / month<br />
PSTN/ISDN 98 100 (2.0)<br />
Mobile voice, Service Provider 89 127 (29.9)<br />
FTEs<br />
Number of FTEs (EoY) 190 178 6.7<br />
Average number of FTEs 178 189 (5.8)<br />
47