- Page 2:
PRIMERA PARTE PANORAMA GENERAL
- Page 8:
primera parte CUADRO 1: DESEMPEÑO
- Page 12:
primera parte ESTADO DEL MEDIO AMBI
- Page 16:
primera parte CUADRO 5: DISTRIBUCI
- Page 20:
primera parte La producción de Cob
- Page 24:
primera parte del volumen total de
- Page 28:
primera parte CUADRO 18: ÍNDICE DE
- Page 32:
primera parte BIBLIOGRAFÍA Banco C
- Page 38:
Capítulo 1 Aire
- Page 44:
capítulo 1 1.5.2.2 Dióxido de azu
- Page 50:
Aire c a p í t u l o 1 El análisi
- Page 54:
Aire c a p í t u l o 1 En la ciuda
- Page 58:
Aire c a p í t u l o 1 CUADRO: 1.6
- Page 62:
Aire c a p í t u l o 1 CUADRO 1.11
- Page 66:
Aire c a p í t u l o 1 Lo anterior
- Page 70:
Aire c a p í t u l o 1 Figura 1.6
- Page 74:
Aire c a p í t u l o 1 trol tanto
- Page 78:
Aire c a p í t u l o 1 Figura 1.12
- Page 82:
Aire c a p í t u l o 1 y los patro
- Page 86:
Aire c a p í t u l o 1 1.4.2.1 Mat
- Page 90:
Aire c a p í t u l o 1 Figura:1.20
- Page 94:
Aire c a p í t u l o 1 Para la est
- Page 98:
Aire c a p í t u l o 1 • Program
- Page 102:
Aire c a p í t u l o 1 Figura:1.22
- Page 106:
Aire c a p í t u l o 1 1.5.4 Otras
- Page 110:
Aire c a p í t u l o 1 CUADRO 1.27
- Page 114:
Aire c a p í t u l o 1 • Fuera d
- Page 118:
Aire c a p í t u l o 1 superada nu
- Page 122:
Aire c a p í t u l o 1 El valor pr
- Page 126:
c a p í t u l o 1 Capítulo 2 Agua
- Page 134: c a p í t u l o 1 67 ESTADO DEL ME
- Page 140: capítulo 2 La distribución mensua
- Page 144: capítulo 2 Con respecto a la dispo
- Page 148: Figura N°2.6.(Continuación) capí
- Page 152: capítulo 2 Figura 2.7. Evolución
- Page 156: capítulo 2 ESTADO DEL MEDIO AMBIEN
- Page 160: capítulo 2 ESTADO DEL MEDIO AMBIEN
- Page 164: Figura 2.12 (Continuación ) capít
- Page 168: capítulo 2 ESTADO DEL MEDIO AMBIEN
- Page 172: capítulo 2 Con relación a la indu
- Page 176: capítulo 2 ESTADO DEL MEDIO AMBIEN
- Page 180: capítulo 2 ESTADO DEL MEDIO AMBIEN
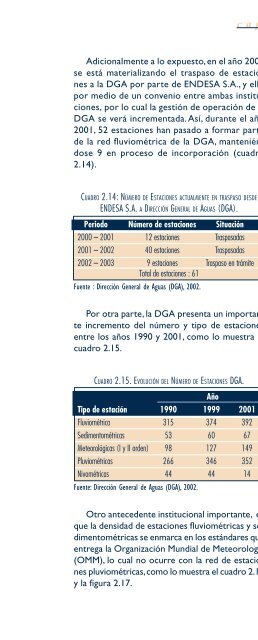
- Page 186: Aguas continentales capítulo 2 CUA
- Page 190: Aguas continentales capítulo 2 En
- Page 194: Aguas continentales capítulo 2 CUA
- Page 198: Aguas continentales capítulo 2 pec
- Page 202: Aguas continentales capítulo 2 nar
- Page 206: Aguas continentales capítulo 2 BIB
- Page 210: 105ESTADO DEL MEDIO AMBIENTE EN CHI
- Page 216: capítulo 2 TABLA 1.2: PRINCIPALES
- Page 220: capítulo 2 III REGIÓN IV REGIÓN
- Page 224: capítulo 2 TABLA 1.7. NÚMERO DE S
- Page 228: capítulo 2 Anexos 1ESTADO DEL MEDI
- Page 232:
capítulo 2 TABLA 1.17 EVOLUCIÓN D
- Page 236:
Anexos 1ESTADO DEL MEDIO AMBIENTE E
- Page 240:
capítulo 2 Anexos 2ESTADO DEL MEDI
- Page 244:
capítulo 2 Anexos 2ESTADO DEL MEDI
- Page 248:
capítulo 2 Anexos 2ESTADO DEL MEDI
- Page 254:
Capítulo 3 Bosques Nativos
- Page 262:
131ESTADO DEL MEDIO AMBIENTE EN CHI
- Page 268:
capítulo 3 ne una altura igual o m
- Page 272:
capítulo 3 Figura 3.2 Distribució
- Page 276:
capítulo 3 3.2 CAUSAS Y CONDICIONA
- Page 280:
capítulo 3 Figura 3.7. Evolución
- Page 284:
capítulo 3 Figura 3.10. Evolución
- Page 288:
capítulo 3 que Emanuelli (1996) ut
- Page 292:
capítulo 3 Figura 3.16. Superficie
- Page 296:
capítulo 3 Bosques Nativos ESTADO
- Page 300:
capítulo 3 Bosques Nativos ESTADO
- Page 304:
capítulo 3 UADRO 3.13. E CUADRO UA
- Page 308:
capítulo 3 Bosques Nativos ESTADO
- Page 312:
Bosques Nativos ESTADO DEL MEDIO AM
- Page 316:
capítulo 3 3.4 CONCLUSIONES Bosque
- Page 320:
capítulo 3 Bosques Nativos ESTADO
- Page 326:
capítulo 4 INDICE 4. DIVERSIDAD BI
- Page 334:
capítulo 4 4.1 ESTADO DE LA DIVERS
- Page 338:
capítulo 4 UADRO 4.1. N CUADRO UAD
- Page 342:
capítulo 4 CUADRO 4.3: RIQUEZA Y E
- Page 346:
capítulo 4 La región desértica c
- Page 350:
capítulo 4 tal (Hajek et al., 1990
- Page 354:
capítulo 4 UADRO 4.7. E CUADRO UAD
- Page 358:
capítulo 4 de diferentes tamaños
- Page 362:
capítulo 4 vale al 9 por ciento de
- Page 366:
capítulo 4 ción, generándose efe
- Page 370:
capítulo 4 de interés agrícola,
- Page 374:
capítulo 4 BIBLIOGRAFÍA Allnutt,
- Page 378:
capítulo 4 Estades, C.F. (2001). I
- Page 382:
capítulo 4 Ituarte, C.F. (1999). P
- Page 386:
capítulo 4 ODI (Overseas Developme
- Page 390:
capítulo 4 Sittenfeld., A., G.Tama
- Page 398:
capítulo 5 ÍNDICE 5. SUELO 203 5.
- Page 406:
capítulo 5 Los suelos de chile son
- Page 410:
capítulo 5 • En los sectores de
- Page 414:
207ESTADO DEL MEDIO AMBIENTE EN CHI
- Page 418:
UADRO 5.3: S capítulo 5 CUADRO UAD
- Page 422:
capítulo 5 UADRO 5.6: E CUADRO UAD
- Page 426:
capítulo 5 UADRO 5.6: E CONTINUACI
- Page 430:
capítulo 5 • Erosión Geológica
- Page 434:
capítulo 5 El principal problema d
- Page 438:
5.10: R capítulo 5 C UADRO 5.10: R
- Page 442:
221ESTADO DEL MEDIO AMBIENTE EN CHI
- Page 446:
capítulo 5 El Censo Agropecuario e
- Page 450:
capítulo 5 el contrario, los deriv
- Page 454:
capítulo 5 UADRO 5.13: D CUADRO UA
- Page 458:
capítulo 5 Continuación Región 5
- Page 462:
capítulo 5 5.2.3 Determinates soci
- Page 466:
233ESTADO DEL MEDIO AMBIENTE EN CHI
- Page 470:
capítulo 5 • La pequeña propied
- Page 474:
capítulo 5 Hortalizas: La producci
- Page 478:
capítulo 5 del Ministerio para acc
- Page 482:
capítulo 5 le y Canadá, relativo
- Page 486:
capítulo 5 BIBLIOGRAFÍA INIA Quil
- Page 490:
Capítulo 6 Ecosistemas Marinos y d
- Page 498:
249ESTADO DEL MEDIO AMBIENTE EN CHI
- Page 504:
capítulo 6 Ecosistemas ESTADO DEL
- Page 508:
capítulo 6 Ecosistemas ESTADO DEL
- Page 512:
capítulo 6 Ecosistemas ESTADO DEL
- Page 516:
capítulo 6 Ecosistemas ESTADO DEL
- Page 520:
capítulo 6 Ecosistemas ESTADO DEL
- Page 524:
capítulo 6 Ecosistemas ESTADO DEL
- Page 528:
capítulo 6 Figura 6.12 Desembarque
- Page 532:
capítulo 6 Ecosistemas ESTADO DEL
- Page 536:
capítulo 6 Figura 6.17 Cadmio en a
- Page 540:
capítulo 6 Figura 6.21 Cobre en ag
- Page 544:
capítulo 6 Figura 6.25 Zinc en agu
- Page 548:
capítulo 6 Figura 6.30 Nitrógeno
- Page 552:
capítulo 6 Figura 6.34 Hidrocarbur
- Page 556:
capítulo 6 Ecosistemas ESTADO DEL
- Page 560:
capítulo 6 Ecosistemas ESTADO DEL
- Page 564:
capítulo 6 Ecosistemas ESTADO DEL
- Page 568:
capítulo 6 R E C U A D R O 6.2 Eco
- Page 572:
capítulo 6 UADRO 6.6 P CUADRO UADR
- Page 576:
capítulo 6 Ecosistemas ESTADO DEL
- Page 580:
capítulo 6 de otra manera temas co
- Page 584:
capítulo 6 Ecosistemas ESTADO DEL
- Page 588:
capítulo 6 Moreno, C.A., P.S.Rubil
- Page 592:
AnexosESTADO DEL MEDIO AMBIENTE EN
- Page 596:
capítulo 61 AnexosESTADO DEL MEDIO
- Page 602:
capítulo 7 INDICE 7. MINERALES E H
- Page 606:
capítulo 7 303 ESTADO DEL MEDIO AM
- Page 612:
capítulo 7 Minerales ESTADO e hidr
- Page 616:
capítulo 7 nominales, respectivame
- Page 620:
capítulo 7 Al ritmo de producción
- Page 624:
capítulo 7 Minerales ESTADO e hidr
- Page 628:
Minerales ESTADO e hidrocarburos DE
- Page 632:
capítulo 7 La información incluye
- Page 636:
capítulo 7 Minerales ESTADO e hidr
- Page 640:
capítulo 7 Figura 7.18: Producció
- Page 644:
Continuación Figuras 7.19: capítu
- Page 648:
capítulo 7 Minerales ESTADO e hidr
- Page 652:
capítulo 7 Continuación UADRO 7.1
- Page 656:
capítulo 7 Minerales ESTADO e hidr
- Page 660:
Minerales e hidrocarburos ESTADO DE
- Page 664:
capítulo 7 Figura 7.12 Porcentaje
- Page 668:
capítulo 7 Minerales ESTADO e hidr
- Page 672:
capítulo 7 Minerales ESTADO e hidr
- Page 676:
capítulo 7 Minerales ESTADO e hidr
- Page 680:
capítulo 7 Minerales ESTADO e hidr
- Page 684:
capítulo 7 UADRO 7.14: E CUADRO UA
- Page 688:
capítulo 7 Minerales ESTADO e hidr
- Page 692:
Los recursos mineros están constit
- Page 696:
capítulo 17 AnexosESTADO DEL MEDIO
- Page 700:
capítulo 17 AnexosESTADO DEL MEDIO
- Page 706:
353ESTADO DEL MEDIO AMBIENTE EN CHI
- Page 714:
Asentamientos humanos 357ESTADO DEL
- Page 720:
capítulo 8 Asentamientos ESTADO DE
- Page 724:
capítulo 8 8.1 C : D (%) C UADRO 8
- Page 728:
capítulo 8 Asentamientos ESTADO DE
- Page 732:
capítulo 8 8.3 CALIDAD AMBIENTAL D
- Page 736:
capítulo 8 Figura 8.3 Expansión f
- Page 740:
capítulo 8 Asentamientos ESTADO DE
- Page 744:
capítulo 8 Asentamientos ESTADO DE
- Page 748:
capítulo 8 Asentamientos ESTADO DE
- Page 752:
capítulo 8 Asentamientos ESTADO DE
- Page 756:
capítulo 8 Asentamientos ESTADO DE
- Page 760:
capítulo 8 Asentamientos ESTADO DE
- Page 764:
capítulo 18 AnexosESTADO DEL MEDIO
- Page 768:
Continuación TABLA 8.2 capítulo 1
- Page 772:
capítulo 18 Continuación TABLA 8.
- Page 778:
capítulo 9 ÍNDICE 9.1. CONSUMO DE
- Page 786:
capítulo 9 9.1. CONSUMO DE ENERGÍ
- Page 790:
capítulo 9 Figura 9.3: Consumo de
- Page 794:
capítulo 9 UADRO 9.2: I CUADRO UAD
- Page 798:
capítulo 9 te, Isla Tierra del Fue
- Page 802:
capítulo 9 30% restante obtenido d
- Page 806:
capítulo 9 de combustible con que
- Page 810:
capítulo 9 UADRO 9.4: P CUADRO UAD
- Page 814:
capítulo 9 La figura 9.13 muestra
- Page 818:
capítulo 9 9.4.2 Recursos para la
- Page 822:
capítulo 9 9.9: E CUADRO 9.9: ESTI
- Page 826:
capítulo 9 Por otra parte, existen
- Page 834:
tercera parte 1. LA GESTIÓN AMBIEN
- Page 838:
tercera parte en las materias que e
- Page 842:
tercera parte gasto total en gesti
- Page 846:
tercera parte acumular una signific
- Page 850:
tercera parte A la fecha, los avanc
- Page 854:
tercera parte vi) Publicación del
- Page 858:
tercera parte Agrícola Monteáguil
- Page 862:
tercera parte 5: : E CUADRO 5: EXPO
- Page 866:
tercera parte da. Sin embargo, las
- Page 870:
tercera parte El caso del Ministeri
- Page 874:
tercera parte Durante el año 1999
- Page 878:
tercera parte Figura 2: Evolución
- Page 882:
tercera parte cunscripción. Entre
- Page 886:
Tercera parte tercera parte Chile n
- Page 890:
9.1: P capítulo 9 CUADRO ANEXO 9.1
- Page 894:
DEL MEDIO AMBIENTE Y DEL PATRIMONIO
- Page 898:
DEL MEDIO AMBIENTE Y DEL PATRIMONIO
- Page 902:
DEL MEDIO AMBIENTE Y DEL PATRIMONIO
- Page 906:
s i g l a s SIGLAS ASIMET BID CAME
- Page 910:
s i g l a s MINSAL Ministerio de Sa
- Page 916:
Indice General ESTADO DEL MEDIO AMB