- Page 2:
PRIMERA PARTE PANORAMA GENERAL
- Page 8:
primera parte CUADRO 1: DESEMPEÑO
- Page 12:
primera parte ESTADO DEL MEDIO AMBI
- Page 16:
primera parte CUADRO 5: DISTRIBUCI
- Page 20:
primera parte La producción de Cob
- Page 24:
primera parte del volumen total de
- Page 28:
primera parte CUADRO 18: ÍNDICE DE
- Page 32:
primera parte BIBLIOGRAFÍA Banco C
- Page 38:
Capítulo 1 Aire
- Page 44:
capítulo 1 1.5.2.2 Dióxido de azu
- Page 50:
Aire c a p í t u l o 1 El análisi
- Page 54:
Aire c a p í t u l o 1 En la ciuda
- Page 58:
Aire c a p í t u l o 1 CUADRO: 1.6
- Page 62:
Aire c a p í t u l o 1 CUADRO 1.11
- Page 66:
Aire c a p í t u l o 1 Lo anterior
- Page 70:
Aire c a p í t u l o 1 Figura 1.6
- Page 74:
Aire c a p í t u l o 1 trol tanto
- Page 78:
Aire c a p í t u l o 1 Figura 1.12
- Page 82:
Aire c a p í t u l o 1 y los patro
- Page 86:
Aire c a p í t u l o 1 1.4.2.1 Mat
- Page 90:
Aire c a p í t u l o 1 Figura:1.20
- Page 94:
Aire c a p í t u l o 1 Para la est
- Page 98:
Aire c a p í t u l o 1 • Program
- Page 102:
Aire c a p í t u l o 1 Figura:1.22
- Page 106:
Aire c a p í t u l o 1 1.5.4 Otras
- Page 110:
Aire c a p í t u l o 1 CUADRO 1.27
- Page 114:
Aire c a p í t u l o 1 • Fuera d
- Page 118:
Aire c a p í t u l o 1 superada nu
- Page 122:
Aire c a p í t u l o 1 El valor pr
- Page 126:
c a p í t u l o 1 Capítulo 2 Agua
- Page 134:
c a p í t u l o 1 67 ESTADO DEL ME
- Page 140:
capítulo 2 La distribución mensua
- Page 144:
capítulo 2 Con respecto a la dispo
- Page 148:
Figura N°2.6.(Continuación) capí
- Page 152:
capítulo 2 Figura 2.7. Evolución
- Page 156:
capítulo 2 ESTADO DEL MEDIO AMBIEN
- Page 160:
capítulo 2 ESTADO DEL MEDIO AMBIEN
- Page 164:
Figura 2.12 (Continuación ) capít
- Page 168:
capítulo 2 ESTADO DEL MEDIO AMBIEN
- Page 172:
capítulo 2 Con relación a la indu
- Page 176:
capítulo 2 ESTADO DEL MEDIO AMBIEN
- Page 180:
capítulo 2 ESTADO DEL MEDIO AMBIEN
- Page 184:
capítulo 2 ESTADO DEL MEDIO AMBIEN
- Page 188:
capítulo 2 2.3.1.2 Cobertura de Se
- Page 192:
capítulo 2 Según datos del Instit
- Page 196:
capítulo 2 ESTADO DEL MEDIO AMBIEN
- Page 200:
capítulo 2 ESTADO DEL MEDIO AMBIEN
- Page 204:
capítulo 2 ESTADO DEL MEDIO AMBIEN
- Page 208:
capítulo 2 Fondo de Fomento al Des
- Page 214:
Anexos 1 capítulo 2 CUADROS ESTAD
- Page 218:
109ESTADO DEL MEDIO AMBIENTE EN CHI
- Page 222:
Anexos 1 capítulo 2 XII REGIÓN TO
- Page 226:
Anexos 1 capítulo 2 TABLA 1.12. ES
- Page 230:
Anexos 1 capítulo 2 TABLA 1.15. ES
- Page 234:
117ESTADO DEL MEDIO AMBIENTE EN CHI
- Page 238:
Anexos 2 INVESTIGACIÓN EN RECURSOS
- Page 242:
Anexos 2 capítulo 2 Hidráulica”
- Page 246:
Anexos 2 capítulo 2 caudales ecol
- Page 250:
Anexos 2 sentan graves externalidad
- Page 258:
capítulo 3 ÍNDICE 3.BOSQUES NATIV
- Page 266:
capítulo 3 Los bosques nativos de
- Page 270:
CUADRO 3.2 capítulo 3 3.2 SUPERFIC
- Page 274:
capítulo 3 Superficie de bosque na
- Page 278:
139ESTADO DEL MEDIO AMBIENTE EN CHI
- Page 282:
capítulo 3 Figura 3.8. Evolución
- Page 286:
capítulo 3 3.2.2 Destrucción y de
- Page 290:
145ESTADO DEL MEDIO AMBIENTE EN CHI
- Page 294:
capítulo 3 3.3 FACTORES E INICIATI
- Page 298:
capítulo 3 una proporción muy peq
- Page 302:
capítulo 3 3.8. L FSC CUADRO 3.8.
- Page 306:
capítulo 3 procurando al mismo tie
- Page 310:
UADRO 3.14. O C UADRO 3.14. OBJETIV
- Page 314:
CONTINUACIÓN UADRO 3.14. O CUADRO
- Page 318:
capítulo 3 las expectativas forest
- Page 322:
Capítulo 4 Diversidad Biológica
- Page 330:
Diversidad Biológica 165ESTADO DEL
- Page 336:
capítulo 4 Diversidad ESTADO DEL B
- Page 340:
capítulo 4 Diversidad ESTADO DEL B
- Page 344:
capítulo 4 ejemplifica en el hecho
- Page 348:
capítulo 4 Diversidad ESTADO DEL B
- Page 352:
capítulo 4 Diversidad ESTADO DEL B
- Page 356:
capítulo 4 Diversidad ESTADO DEL B
- Page 360:
capítulo 4 Diversidad ESTADO DEL B
- Page 364:
capítulo 4 Diversidad ESTADO DEL B
- Page 368:
capítulo 4 Diversidad ESTADO DEL B
- Page 372:
capítulo 4 Diversidad ESTADO DEL B
- Page 376:
capítulo 4 Diversidad ESTADO DEL B
- Page 380:
capítulo 4 ding the description of
- Page 384:
capítulo 4 Diversidad ESTADO DEL B
- Page 388:
capítulo 4 Robbins, C. (1997) US m
- Page 394:
Capítulo 5 Suelos
- Page 402:
201ESTADO DEL MEDIO AMBIENTE EN CHI
- Page 408:
capítulo 5 Suelos ESTADO DEL MEDIO
- Page 412:
capítulo 5 Suelos ESTADO DEL MEDIO
- Page 416:
capítulo 5 ciones. En el cuadro 5.
- Page 420:
capítulo 5 les, cuando el daño re
- Page 424:
capítulo 5 Suelos ESTADO DEL MEDIO
- Page 428:
capítulo 5 Figura 5.2 Distribució
- Page 432:
capítulo 5 Suelos ESTADO DEL MEDIO
- Page 436:
capítulo 5 Suelos ESTADO DEL MEDIO
- Page 440:
capítulo 5 El suelo posee una capa
- Page 444:
capítulo 5 Suelos ESTADO DEL MEDIO
- Page 448:
capítulo 5 Figura 5.7: Porcentaje
- Page 452:
capítulo 5 (iii) la degradación b
- Page 456:
capítulo 5 aguas abajo de las desc
- Page 460:
Suelos ESTADO DEL MEDIO AMBIENTE EN
- Page 464:
Suelos ESTADO DEL MEDIO AMBIENTE EN
- Page 468:
capítulo 5 5.2.3.2 Estructura de t
- Page 472:
capítulo 5 Suelos ESTADO DEL MEDIO
- Page 476:
capítulo 5 Suelos ESTADO DEL MEDIO
- Page 480:
capítulo 5 Suelos ESTADO DEL MEDIO
- Page 484:
Suelos ESTADO DEL MEDIO AMBIENTE EN
- Page 488:
capítulo 5 Suelos ESTADO DEL MEDIO
- Page 494:
capítulo 6 INDICE 6.1 ESTADO DE LO
- Page 502:
capítulo 6 6.1 ESTADO DE LOS ECOSI
- Page 506:
capítulo 6 Respecto a las playas a
- Page 510:
255ESTADO DEL MEDIO AMBIENTE EN CHI
- Page 514:
capítulo 6 UADRO 6.1 R CUADRO UADR
- Page 518:
capítulo 6 Figura 6.4 Desembarque
- Page 522:
capítulo 6 o se prohíba la pesca
- Page 526:
capítulo 6 Figura 6.10 Desembarque
- Page 530:
capítulo 6 ques en los años 1991,
- Page 534:
capítulo 6 UADRO 6.2: E CUADRO UAD
- Page 538:
capítulo 6 Figura 6.19 Cromo en Ag
- Page 542:
capítulo 6 Figura 6.23 Mercurio en
- Page 546:
capítulo 6 Figura 6.29 Materia org
- Page 550:
capítulo 6 Figura 6.32 Hidrocarbur
- Page 554:
capítulo 6 Figura 6.36 Producción
- Page 558:
6.4. N capítulo 6 CUADRO 6.4. NÚM
- Page 562:
capítulo 6 R E C U A D R O 6.1 S I
- Page 566:
capítulo 6 áreas protegidas (Fair
- Page 570:
capítulo 6 lizando para ello antec
- Page 574:
capítulo 6 R E C U A D R O 6.3 Des
- Page 578:
capítulo 6 aprobados por el CNP y
- Page 582:
capítulo 6 BIBLIOGRAFÍA Ahumada,
- Page 586:
capítulo 6 Holland, D.S. & R.J. Br
- Page 590:
295ESTADO DEL MEDIO AMBIENTE EN CHI
- Page 594:
capítulo 61 TABLA 6.3 PROMEDIOS RO
- Page 598:
Capítulo 7 Minerales e Hidrocarbur
- Page 604:
Minerales ESTADO e hidrocarburos DE
- Page 610:
capítulo 7 El presente capítulo,
- Page 614:
capítulo 7 mostrados e inferidos,
- Page 618:
capítulo 7 11,47 millones de tonel
- Page 622:
capítulo 7 Figura 7.6: Reservas y
- Page 626:
nación fueron aprobados recienteme
- Page 630:
capítulo 7 1999 para Paipote y has
- Page 634:
capítulo 7 Fuente: DGA,1996 Calida
- Page 638:
capítulo 7 Figura 7.16 Concentraci
- Page 642:
capítulo 7 miles de toneladas. Est
- Page 646:
Continuación Figuras 7.20 capítul
- Page 650:
capítulo 7 En Chile el drenaje ác
- Page 654:
capítulo 7 327 Figura 7.21: Riesgo
- Page 658:
capítulo 7 estudio no se dirige a
- Page 662:
capítulo 7 Finalmente, en una terc
- Page 666:
7.12 CUADRO 7.12 MUESTRA LAS EXPORT
- Page 670:
capítulo 7 Es posible observar que
- Page 674:
capítulo 7 c- El Servicio Nacional
- Page 678:
capítulo 7 cimientos de hidrocarbu
- Page 682:
capítulo 7 La participación en la
- Page 686:
capítulo 7 muestra un estancamient
- Page 690:
capítulo 7 SGA, 1998. “Cuantific
- Page 694:
capítulo 71 de un yacimiento se co
- Page 698:
capítulo 71 en 1996 por la Gerenci
- Page 702:
351ESTADO DEL MEDIO AMBIENTE EN CHI
- Page 710:
capítulo 8 INDICE 8 ASENTAMIENTO H
- Page 718: capítulo 8 8.1. CARACTERIZACIÓN D
- Page 722: 361ESTADO DEL MEDIO AMBIENTE EN CHI
- Page 726: capítulo 8 8.3 C : P C UADRO 8.3 C
- Page 730: capítulo 8 casos más relevantes,
- Page 734: capítulo 8 R E C U A D R O 8. 2 EX
- Page 738: capítulo 8 R E C U A D R O 8. 3 L
- Page 742: capítulo 8 Figura C Figura D Figur
- Page 746: capítulo 8 UADRO 8.7 C C UADRO 8.7
- Page 750: capítulo 8 8.4. RESPUESTAS E INICI
- Page 754: capítulo 8 R E C U A D R O 8. 5 PR
- Page 758: capítulo 8 BIBLIOGRAFÍA Arenas, F
- Page 762: ANEXO anexo 8.1 C : P capítulo 81
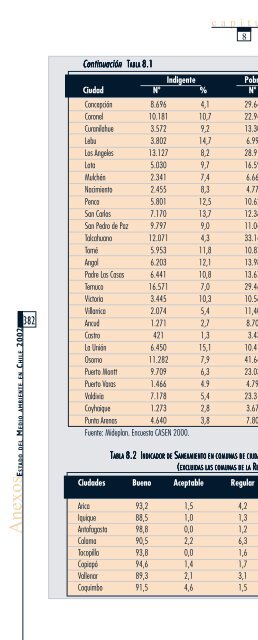
- Page 768: Continuación TABLA 8.2 capítulo 1
- Page 772: capítulo 18 Continuación TABLA 8.
- Page 778: capítulo 9 ÍNDICE 9.1. CONSUMO DE
- Page 786: capítulo 9 9.1. CONSUMO DE ENERGÍ
- Page 790: capítulo 9 Figura 9.3: Consumo de
- Page 794: capítulo 9 UADRO 9.2: I CUADRO UAD
- Page 798: capítulo 9 te, Isla Tierra del Fue
- Page 802: capítulo 9 30% restante obtenido d
- Page 806: capítulo 9 de combustible con que
- Page 810: capítulo 9 UADRO 9.4: P CUADRO UAD
- Page 814:
capítulo 9 La figura 9.13 muestra
- Page 818:
capítulo 9 9.4.2 Recursos para la
- Page 822:
capítulo 9 9.9: E CUADRO 9.9: ESTI
- Page 826:
capítulo 9 Por otra parte, existen
- Page 834:
tercera parte 1. LA GESTIÓN AMBIEN
- Page 838:
tercera parte en las materias que e
- Page 842:
tercera parte gasto total en gesti
- Page 846:
tercera parte acumular una signific
- Page 850:
tercera parte A la fecha, los avanc
- Page 854:
tercera parte vi) Publicación del
- Page 858:
tercera parte Agrícola Monteáguil
- Page 862:
tercera parte 5: : E CUADRO 5: EXPO
- Page 866:
tercera parte da. Sin embargo, las
- Page 870:
tercera parte El caso del Ministeri
- Page 874:
tercera parte Durante el año 1999
- Page 878:
tercera parte Figura 2: Evolución
- Page 882:
tercera parte cunscripción. Entre
- Page 886:
Tercera parte tercera parte Chile n
- Page 890:
9.1: P capítulo 9 CUADRO ANEXO 9.1
- Page 894:
DEL MEDIO AMBIENTE Y DEL PATRIMONIO
- Page 898:
DEL MEDIO AMBIENTE Y DEL PATRIMONIO
- Page 902:
DEL MEDIO AMBIENTE Y DEL PATRIMONIO
- Page 906:
s i g l a s SIGLAS ASIMET BID CAME
- Page 910:
s i g l a s MINSAL Ministerio de Sa
- Page 916:
Indice General ESTADO DEL MEDIO AMB