Rapport Bilan Carbone de l'université Paris Diderot.
Rapport Bilan Carbone de l'université Paris Diderot.
Rapport Bilan Carbone de l'université Paris Diderot.

You also want an ePaper? Increase the reach of your titles
YUMPU automatically turns print PDFs into web optimized ePapers that Google loves.
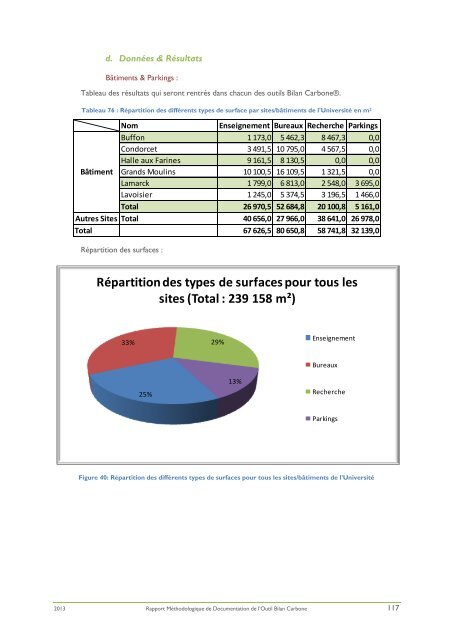
d. Données & Résultats<br />
Bâtiments & Parkings :<br />
Tableau <strong>de</strong>s résultats qui seront rentrés dans chacun <strong>de</strong>s outils <strong>Bilan</strong> <strong>Carbone</strong>®.<br />
Tableau 76 : Répartition <strong>de</strong>s différents types <strong>de</strong> surface par sites/bâtiments <strong>de</strong> l'Université en m 2<br />
Nom<br />
Enseignement Bureaux Recherche Parkings<br />
Buffon 1 173,0 5 462,3 8 467,3 0,0<br />
Condorcet 3 491,5 10 795,0 4 567,5 0,0<br />
Halle aux Farines 9 161,5 8 130,5 0,0 0,0<br />
Bâtiment Grands Moulins 10 100,5 16 109,5 1 321,5 0,0<br />
Lamarck 1 799,0 6 813,0 2 548,0 3 695,0<br />
Lavoisier 1 245,0 5 374,5 3 196,5 1 466,0<br />
Total 26 970,5 52 684,8 20 100,8 5 161,0<br />
Autres Sites Total 40 656,0 27 966,0 38 641,0 26 978,0<br />
Total 67 626,5 80 650,8 58 741,8 32 139,0<br />
Répartition <strong>de</strong>s surfaces :<br />
Répartition <strong>de</strong>s types <strong>de</strong> surfaces pour tous les<br />
sites (Total : 239 158 m²)<br />
33% 29%<br />
Enseignement<br />
25%<br />
13%<br />
Bureaux<br />
Recherche<br />
Parkings<br />
Figure 40: Répartition <strong>de</strong>s différents types <strong>de</strong> surfaces pour tous les sites/bâtiments <strong>de</strong> l'Université<br />
2013 <strong>Rapport</strong> Méthodologique <strong>de</strong> Documentation <strong>de</strong> l’Outil <strong>Bilan</strong> <strong>Carbone</strong> 117