Rapport Bilan Carbone de l'université Paris Diderot.
Rapport Bilan Carbone de l'université Paris Diderot.
Rapport Bilan Carbone de l'université Paris Diderot.
Create successful ePaper yourself
Turn your PDF publications into a flip-book with our unique Google optimized e-Paper software.
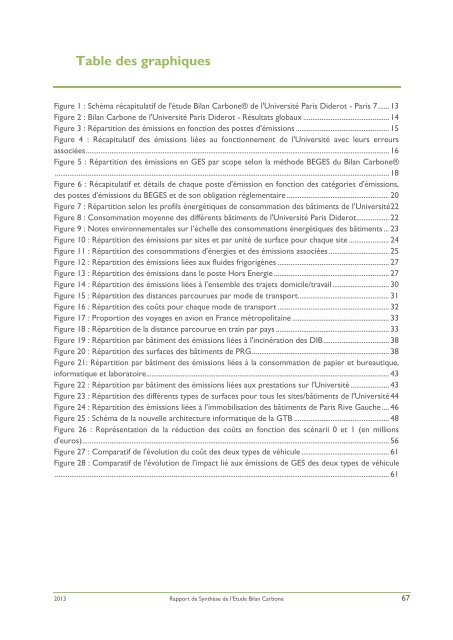
Table <strong>de</strong>s graphiques<br />
Figure 1 : Schéma récapitulatif <strong>de</strong> l'étu<strong>de</strong> <strong>Bilan</strong> <strong>Carbone</strong>® <strong>de</strong> l'Université <strong>Paris</strong> Di<strong>de</strong>rot - <strong>Paris</strong> 7 ...... 13<br />
Figure 2 : <strong>Bilan</strong> <strong>Carbone</strong> <strong>de</strong> l'Université <strong>Paris</strong> Di<strong>de</strong>rot - Résultats globaux ............................................... 14<br />
Figure 3 : Répartition <strong>de</strong>s émissions en fonction <strong>de</strong>s postes d'émissions ................................................... 15<br />
Figure 4 : Récapitulatif <strong>de</strong>s émissions liées au fonctionnement <strong>de</strong> l'Université avec leurs erreurs<br />
associées ...................................................................................................................................................................... 16<br />
Figure 5 : Répartition <strong>de</strong>s émissions en GES par scope selon la métho<strong>de</strong> BEGES du <strong>Bilan</strong> <strong>Carbone</strong>®<br />
....................................................................................................................................................................................... 18<br />
Figure 6 : Récapitulatif et détails <strong>de</strong> chaque poste d'émission en fonction <strong>de</strong>s catégories d'émissions,<br />
<strong>de</strong>s postes d'émissions du BEGES et <strong>de</strong> son obligation réglementaire ........................................................ 20<br />
Figure 7 : Répartition selon les profils énergétiques <strong>de</strong> consommation <strong>de</strong>s bâtiments <strong>de</strong> l’Université22<br />
Figure 8 : Consommation moyenne <strong>de</strong>s différents bâtiments <strong>de</strong> l'Université <strong>Paris</strong> Di<strong>de</strong>rot .................. 22<br />
Figure 9 : Notes environnementales sur l’échelle <strong>de</strong>s consommations énergétiques <strong>de</strong>s bâtiments ... 23<br />
Figure 10 : Répartition <strong>de</strong>s émissions par sites et par unité <strong>de</strong> surface pour chaque site ...................... 24<br />
Figure 11 : Répartition <strong>de</strong>s consommations d'énergies et <strong>de</strong>s émissions associées ................................. 25<br />
Figure 12 : Répartition <strong>de</strong>s émissions liées aux flui<strong>de</strong>s frigorigènes ............................................................. 27<br />
Figure 13 : Répartition <strong>de</strong>s émissions dans le poste Hors Energie ............................................................... 27<br />
Figure 14 : Répartition <strong>de</strong>s émissions liées à l’ensemble <strong>de</strong>s trajets domicile/travail ............................... 30<br />
Figure 15 : Répartition <strong>de</strong>s distances parcourues par mo<strong>de</strong> <strong>de</strong> transport.................................................. 31<br />
Figure 16 : Répartition <strong>de</strong>s coûts pour chaque mo<strong>de</strong> <strong>de</strong> transport ............................................................. 32<br />
Figure 17 : Proportion <strong>de</strong>s voyages en avion en France métropolitaine ..................................................... 33<br />
Figure 18 : Répartition <strong>de</strong> la distance parcourue en train par pays .............................................................. 33<br />
Figure 19 : Répartition par bâtiment <strong>de</strong>s émissions liées à l'incinération <strong>de</strong>s DIB .................................... 38<br />
Figure 20 : Répartition <strong>de</strong>s surfaces <strong>de</strong>s bâtiments <strong>de</strong> PRG ........................................................................... 38<br />
Figure 21: Répartition par bâtiment <strong>de</strong>s émissions liées à la consommation <strong>de</strong> papier et bureautique,<br />
informatique et laboratoire..................................................................................................................................... 43<br />
Figure 22 : Répartition par bâtiment <strong>de</strong>s émissions liées aux prestations sur l'Université ..................... 43<br />
Figure 23 : Répartition <strong>de</strong>s différents types <strong>de</strong> surfaces pour tous les sites/bâtiments <strong>de</strong> l'Université 44<br />
Figure 24 : Répartition <strong>de</strong>s émissions liées à l’immobilisation <strong>de</strong>s bâtiments <strong>de</strong> <strong>Paris</strong> Rive Gauche .... 46<br />
Figure 25 : Schéma <strong>de</strong> la nouvelle architecture informatique <strong>de</strong> la GTB .................................................... 48<br />
Figure 26 : Représentation <strong>de</strong> la réduction <strong>de</strong>s coûts en fonction <strong>de</strong>s scénarii 0 et 1 (en millions<br />
d'euros) ........................................................................................................................................................................ 56<br />
Figure 27 : Comparatif <strong>de</strong> l'évolution du coût <strong>de</strong>s <strong>de</strong>ux types <strong>de</strong> véhicule ................................................ 61<br />
Figure 28 : Comparatif <strong>de</strong> l'évolution <strong>de</strong> l'impact lié aux émissions <strong>de</strong> GES <strong>de</strong>s <strong>de</strong>ux types <strong>de</strong> véhicule<br />
....................................................................................................................................................................................... 61<br />
2013 <strong>Rapport</strong> <strong>de</strong> Synthèse <strong>de</strong> l’Etu<strong>de</strong> <strong>Bilan</strong> <strong>Carbone</strong> 67


