Tableau 58 : Distances totales parcourues pour la moyenne sur « 200 » universités <strong>Paris</strong> Di<strong>de</strong>rot réparties par bâtiments/sites et par localisations (urbain ou périurbain) 200 Universités Méthodo BC Bâtiment PRG Voit Covoit 2roues VoP Bus TER RER MT TGV Buffon 197 422,4 55 380,8 50 103,0 156 752,7 291 865,6 504 567,3 1565278,8 1 135 468,6 194 608,3 Condorcet 179 795,4 50 436,1 45 629,5 142 756,9 265 806,2 459 516,6 1 425 521,7 1 034 087,5 177 232,5 Urbain Grands Moulins 602 843,4 169 109,3 152 993,0 478 655,4 891 232,4 1 540 732,2 4 779 690,6 3 467 234,6 594 250,3 Halle aux Farines 2 806 218,4 787 198,6 712 178,0 2 228 127,1 4 148 660,9 7 172 063,2 22 249 319,9 16 139 875,5 2 766 217,6 Lamarck 363 116,2 101 861,1 92 153,7 288 312,9 536 824,2 928 043,4 2 878 994,9 2 088 451,2 357 940,2 Lavoisier 130 439,8 36 590,9 33 103,7 103 568,7 192 839,8 333 374,8 1 034 202,1 750 220,3 128 580,5 Buffon 5 916,6 1 659,7 1 501,6 4 697,8 8 747,0 15 121,6 0,0 0,0 5 832,3 Condorcet 5 388,4 1 511,5 1 367,5 4 278,3 7 966,1 13 771,4 0,0 0,0 5 311,6 Péri Urbain Grands Moulins 18 066,9 5 068,1 4 585,1 14 345,0 26 709,7 46 174,8 0,0 0,0 17 809,3 Halle aux Farines 84 100,7 23 591,9 21 343,6 66 775,7 124 333,0 214 942,6 0,0 0,0 82 901,9 Lamarck 10 882,4 3 052,7 2 761,8 8 640,6 16 088,3 27 812,9 0,0 0,0 10 727,3 Lavoisier 3 909,2 1 096,6 992,1 3 103,9 5 779,3 9 991,0 0,0 0,0 3 853,5 Autres Sites Urbain Autres Bâtiments 1 656 938,0 464 803,2 420 507,1 1 315 602,7 2 449 586,2 4 234 761,0 13 139 580,1 9 531 580,6 1 633 319,4 Péri Urbain Autres Bâtiments 49 657,5 13 929,9 12 602,4 39 427,8 73 412,7 126 913,3 0,0 0,0 48 949,6 Total 6 114 695,3 1 715 290,5 1 551 821,9 4 855 045,6 9 039 851,4 15 627 786,1 47 072 588,0 34 146 918,4 6 027 534,2 Erreur Absolue 180 724,0 82 561,6 90 603,0 87 851,8 147 776,3 444 838,6 367 094,9 266 294,3 389 137,8 Erreur Relative 3,0% 4,8% 5,8% 1,8% 1,6% 2,8% 0,8% 0,8% 1,1% Erreur sur les constantes 39,3% 50,0% 52,3% 22,2% 49,0% 40,6% 39,0% 39,0% 44,4% Erreur Totale 42,2% 54,8% 58,2% 24,0% 50,7% 43,5% 39,8% 39,8% 45,5% PRG par bâtiment Personnel d. Données & Résultats Tableau 59 : Distances totales parcourues par le personnel pour l’Université <strong>Paris</strong> Di<strong>de</strong>rot réparties par bâtiments/sites Sites Bâtiments/Sites Voit Covoit 2roues VoP Bus TER RER MT TGV Buffon 234 305,9 34 419,3 37 427,0 225 842,2 317 015,6 132 236,8 381622,3 2 834 234,0 2 801 712,6 Condorcet 186 145,2 27 344,5 29 734,0 179 421,2 251 854,2 105 056,0 2 447 853,0 2 251 667,3 2 225 830,5 Grands Moulins 202 658,1 29 770,2 32 371,7 195 337,6 274 196,1 114 375,5 1 944 705,5 2 451 411,9 2 423 283,2 Halle aux Farines 10 508,2 1 543,6 1 678,5 10 128,6 14 217,6 5 930,6 2 117 219,7 127 110,2 125 651,7 Lamarck 131 338,9 19 293,5 20 979,5 126 594,6 177 701,4 74 124,6 109 781,8 1 588 714,2 1 570 484,5 Lavoisier 65 191,2 9 576,5 10 413,3 62 836,3 88 203,6 36 792,4 1 372 130,5 788 572,0 779 523,6 Transverse 251 696,3 36 973,9 40 204,8 242 604,4 340 544,8 142 051,5 681 068,8 3 044 593,1 3 009 657,9 Autres Sites Autres Bâtiments 755 853,1 115 476,1 125 781,3 988 112,4 1 387 932,5 576 061,7 9 038 493,8 2 358 037,7 13 026 945,7 Total 1 837 697,0 274 397,6 298 590,2 2 030 877,4 2 851 665,8 1 186 629,1 18 092 875,5 15 444 340,5 25 963 089,7 PRG par bâtiment On utilise donc les métho<strong>de</strong>s suivantes : Pour la voiture et le covoiturage : Déplacements en voiture dans le cadre du travail : calcul à partir <strong>de</strong>s kilométrages parcourus – « Banlieue Urbaine, V6.1 » Pour les 2roues : Déplacement <strong>de</strong>s employés en 2 roues : calculs à partir <strong>de</strong>s véhicule.km – « Moto cylindrée < 750 cm³, essence, zone urbaine » Pour le Bus : Déplacement <strong>de</strong>s employés en Bus & autocar : calcul à partir <strong>de</strong>s personne.km - Bus, réseaux urbains Classe 1 (zone urbaine et interurbaine) Déplacement <strong>de</strong>s employés en Bus & autocar : calcul à partir <strong>de</strong>s personne.km - Bus, réseaux urbains et interurbains Classe 3 (zone urbaine et péri urbaine) 98 Université <strong>Paris</strong> Di<strong>de</strong>rot – <strong>Paris</strong> 7 <strong>Paris</strong> Di<strong>de</strong>rot Développement Durable
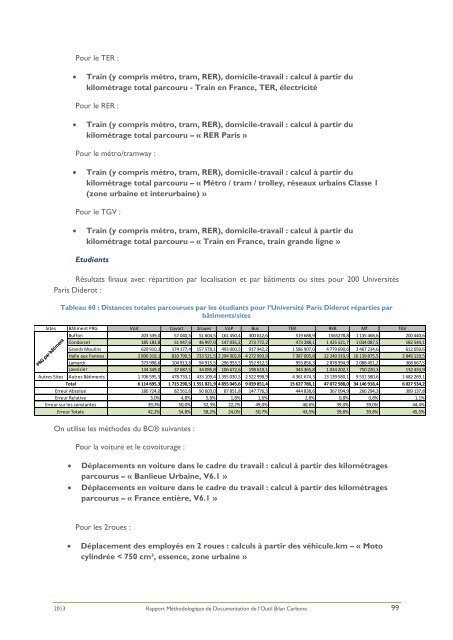
Pour le TER : Train (y compris métro, tram, RER), domicile-travail : calcul à partir du kilométrage total parcouru - Train en France, TER, électricité Pour le RER : Train (y compris métro, tram, RER), domicile-travail : calcul à partir du kilométrage total parcouru – « RER <strong>Paris</strong> » Pour le métro/tramway : Train (y compris métro, tram, RER), domicile-travail : calcul à partir du kilométrage total parcouru – « Métro / tram / trolley, réseaux urbains Classe 1 (zone urbaine et interurbaine) » Pour le TGV : Train (y compris métro, tram, RER), domicile-travail : calcul à partir du kilométrage total parcouru – « Train en France, train gran<strong>de</strong> ligne » Etudiants Résultats finaux avec répartition par localisation et par bâtiments ou sites pour 200 Universités <strong>Paris</strong> Di<strong>de</strong>rot : Tableau 60 : Distances totales parcourues par les étudiants pour l’Université <strong>Paris</strong> Di<strong>de</strong>rot réparties par bâtiments/sites Sites Bâtiment PRG Voit Covoit 2roues VoP Bus TER RER MT TGV Buffon 203 339,0 57 040,5 51 604,5 161 450,4 300 612,6 519 688,9 1565278,8 1 135 468,6 200 440,6 Condorcet 185 183,8 51 947,6 46 997,0 147 035,2 273 772,2 473 288,1 1 425 521,7 1 034 087,5 182 544,1 Grands Moulins 620 910,3 174 177,4 157 578,1 493 000,5 917 942,2 1 586 907,0 4 779 690,6 3 467 234,6 612 059,6 Halle aux Farines 2 890 319,1 810 790,5 733 521,5 2 294 902,8 4 272 993,9 7 387 005,8 22 249 319,9 16 139 875,5 2 849 119,5 Lamarck 373 998,6 104 913,8 94 915,5 296 953,5 552 912,5 955 856,3 2 878 994,9 2 088 451,2 368 667,5 Lavoisier 134 349,0 37 687,5 34 095,8 106 672,6 198 619,1 343 365,8 1 034 202,1 750 220,3 132 433,9 Autres Sites Autres Bâtiments 1 706 595,5 478 733,1 433 109,4 1 355 030,5 2 522 998,9 4 361 674,3 13 139 580,1 9 531 580,6 1 682 269,1 Total 6 114 695,3 1 715 290,5 1 551 821,9 4 855 045,6 9 039 851,4 15 627 786,1 47 072 588,0 34 146 918,4 6 027 534,2 Erreur Absolue 180 724,0 82 561,6 90 603,0 87 851,8 147 776,3 444 838,6 367 094,9 266 294,3 389 137,8 Erreur Relative 3,0% 4,8% 5,8% 1,8% 1,6% 2,8% 0,8% 0,8% 1,1% Erreur sur les constantes 39,3% 50,0% 52,3% 22,2% 49,0% 40,6% 39,0% 39,0% 44,4% Erreur Totale 42,2% 54,8% 58,2% 24,0% 50,7% 43,5% 39,8% 39,8% 45,5% PRG par bâtiment On utilise les métho<strong>de</strong>s du BC® suivantes : Pour la voiture et le covoiturage : Déplacements en voiture dans le cadre du travail : calcul à partir <strong>de</strong>s kilométrages parcourus – « Banlieue Urbaine, V6.1 » Déplacements en voiture dans le cadre du travail : calcul à partir <strong>de</strong>s kilométrages parcourus – « France entière, V6.1 » Pour les 2roues : Déplacement <strong>de</strong>s employés en 2 roues : calculs à partir <strong>de</strong>s véhicule.km – « Moto cylindrée < 750 cm³, essence, zone urbaine » 2013 <strong>Rapport</strong> Méthodologique <strong>de</strong> Documentation <strong>de</strong> l’Outil <strong>Bilan</strong> <strong>Carbone</strong> 99