Rapport Bilan Carbone de l'université Paris Diderot.
Rapport Bilan Carbone de l'université Paris Diderot.
Rapport Bilan Carbone de l'université Paris Diderot.

Create successful ePaper yourself
Turn your PDF publications into a flip-book with our unique Google optimized e-Paper software.
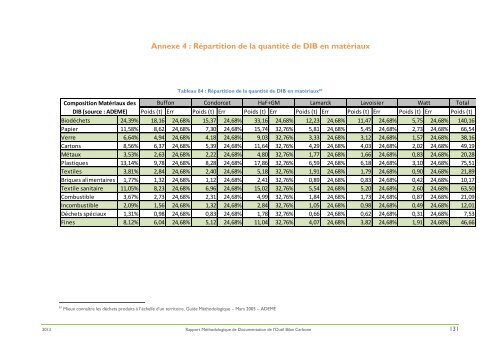
Annexe 4 : Répartition <strong>de</strong> la quantité <strong>de</strong> DIB en matériaux<br />
Composition Matériaux <strong>de</strong>s<br />
DIB (source : ADEME)<br />
Tableau 84 : Répartition <strong>de</strong> la quantité <strong>de</strong> DIB en matériaux 97<br />
Buffon Condorcet HaF+GM Lamarck Lavoisier Watt Total<br />
Poids (t) Err Poids (t) Err Poids (t) Err Poids (t) Err Poids (t) Err Poids (t) Err Poids (t)<br />
Biodéchets 24,39% 18,16 24,68% 15,37 24,68% 33,16 24,68% 12,23 24,68% 11,47 24,68% 5,75 24,68% 140,16<br />
Papier 11,58% 8,62 24,68% 7,30 24,68% 15,74 32,76% 5,81 24,68% 5,45 24,68% 2,73 24,68% 66,54<br />
Verre 6,64% 4,94 24,68% 4,18 24,68% 9,03 32,76% 3,33 24,68% 3,12 24,68% 1,57 24,68% 38,16<br />
Cartons 8,56% 6,37 24,68% 5,39 24,68% 11,64 32,76% 4,29 24,68% 4,03 24,68% 2,02 24,68% 49,19<br />
Métaux 3,53% 2,63 24,68% 2,22 24,68% 4,80 32,76% 1,77 24,68% 1,66 24,68% 0,83 24,68% 20,28<br />
Plastiques 13,14% 9,78 24,68% 8,28 24,68% 17,86 32,76% 6,59 24,68% 6,18 24,68% 3,10 24,68% 75,51<br />
Textiles 3,81% 2,84 24,68% 2,40 24,68% 5,18 32,76% 1,91 24,68% 1,79 24,68% 0,90 24,68% 21,89<br />
Briques alimentaires 1,77% 1,32 24,68% 1,12 24,68% 2,41 32,76% 0,89 24,68% 0,83 24,68% 0,42 24,68% 10,17<br />
Textile sanitaire 11,05% 8,23 24,68% 6,96 24,68% 15,02 32,76% 5,54 24,68% 5,20 24,68% 2,60 24,68% 63,50<br />
Combustible 3,67% 2,73 24,68% 2,31 24,68% 4,99 32,76% 1,84 24,68% 1,73 24,68% 0,87 24,68% 21,09<br />
Incombustible 2,09% 1,56 24,68% 1,32 24,68% 2,84 32,76% 1,05 24,68% 0,98 24,68% 0,49 24,68% 12,01<br />
Déchets spéciaux 1,31% 0,98 24,68% 0,83 24,68% 1,78 32,76% 0,66 24,68% 0,62 24,68% 0,31 24,68% 7,53<br />
Fines 8,12% 6,04 24,68% 5,12 24,68% 11,04 32,76% 4,07 24,68% 3,82 24,68% 1,91 24,68% 46,66<br />
97<br />
Mieux connaître les déchets produits à l’échelle d’un territoire, Gui<strong>de</strong> Méthodologique – Mars 2005 – ADEME<br />
2013 <strong>Rapport</strong> Méthodologique <strong>de</strong> Documentation <strong>de</strong> l’Outil <strong>Bilan</strong> <strong>Carbone</strong> 131