Rapport Bilan Carbone de l'université Paris Diderot.
Rapport Bilan Carbone de l'université Paris Diderot.
Rapport Bilan Carbone de l'université Paris Diderot.

You also want an ePaper? Increase the reach of your titles
YUMPU automatically turns print PDFs into web optimized ePapers that Google loves.
Répartition en pourcentage <strong>de</strong>s consommations :<br />
100%<br />
90%<br />
80%<br />
70%<br />
60%<br />
50%<br />
40%<br />
30%<br />
20%<br />
10%<br />
0%<br />
Répartition <strong>de</strong>s profils énergétiques <strong>de</strong>s bâtiments <strong>de</strong><br />
l'Université<br />
Conso Gaz (kWh)<br />
Conso Vapeur<br />
(kWh)<br />
Conso Electricité<br />
Eprimaire (kWh)<br />
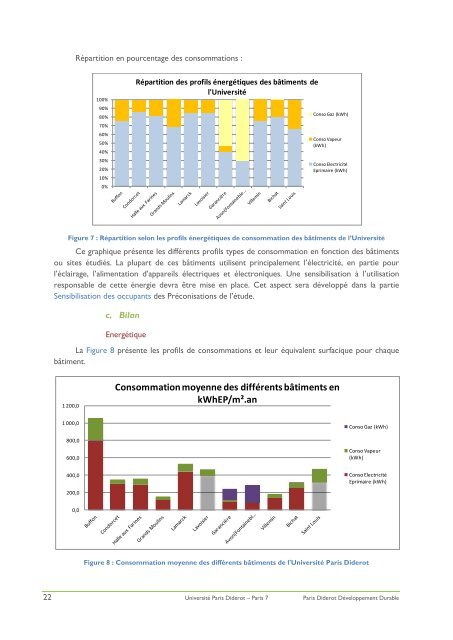
Figure 7 : Répartition selon les profils énergétiques <strong>de</strong> consommation <strong>de</strong>s bâtiments <strong>de</strong> l’Université<br />
Ce graphique présente les différents profils types <strong>de</strong> consommation en fonction <strong>de</strong>s bâtiments<br />
ou sites étudiés. La plupart <strong>de</strong> ces bâtiments utilisent principalement l’électricité, en partie pour<br />
l’éclairage, l’alimentation d’appareils électriques et électroniques. Une sensibilisation à l’utilisation<br />
responsable <strong>de</strong> cette énergie <strong>de</strong>vra être mise en place. Cet aspect sera développé dans la partie<br />
Sensibilisation <strong>de</strong>s occupants <strong>de</strong>s Préconisations <strong>de</strong> l’étu<strong>de</strong>.<br />
c. <strong>Bilan</strong><br />
Energétique<br />
La Figure 8 présente les profils <strong>de</strong> consommations et leur équivalent surfacique pour chaque<br />
bâtiment.<br />
1 200,0<br />
Consommation moyenne <strong>de</strong>s différents bâtiments en<br />
kWhEP/m².an<br />
1 000,0<br />
800,0<br />
600,0<br />
Conso Gaz (kWh)<br />
Conso Vapeur<br />
(kWh)<br />
400,0<br />
200,0<br />
Conso Electricité<br />
Eprimaire (kWh)<br />
0,0<br />
Figure 8 : Consommation moyenne <strong>de</strong>s différents bâtiments <strong>de</strong> l'Université <strong>Paris</strong> Di<strong>de</strong>rot<br />
22 Université <strong>Paris</strong> Di<strong>de</strong>rot – <strong>Paris</strong> 7 <strong>Paris</strong> Di<strong>de</strong>rot Développement Durable