Rapport Bilan Carbone de l'université Paris Diderot.
Rapport Bilan Carbone de l'université Paris Diderot.
Rapport Bilan Carbone de l'université Paris Diderot.

You also want an ePaper? Increase the reach of your titles
YUMPU automatically turns print PDFs into web optimized ePapers that Google loves.
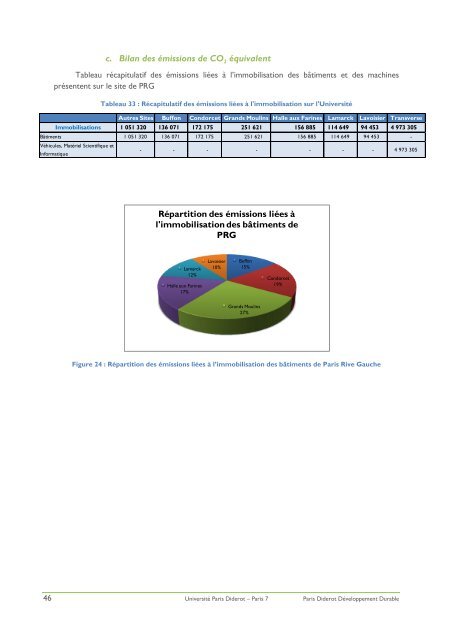
c. <strong>Bilan</strong> <strong>de</strong>s émissions <strong>de</strong> CO 2 équivalent<br />
Tableau récapitulatif <strong>de</strong>s émissions liées à l’immobilisation <strong>de</strong>s bâtiments et <strong>de</strong>s machines<br />
présentent sur le site <strong>de</strong> PRG<br />
Tableau 33 : Récapitulatif <strong>de</strong>s émissions liées à l'immobilisation sur l'Université<br />
Autres Sites Buffon Condorcet Grands Moulins Halle aux Farines Lamarck Lavoisier Transverse<br />
Immobilisations 1 051 320 136 071 172 175 251 621 156 885 114 649 94 453 4 973 305<br />
Bâtiments 1 051 320 136 071 172 175 251 621 156 885 114 649 94 453 -<br />
Véhicules, Matériel Scientifique et<br />
Informatique<br />
- - - - - - - 4 973 305<br />
Répartition <strong>de</strong>s émissions liées à<br />
l'immobilisation <strong>de</strong>s bâtiments <strong>de</strong><br />
PRG<br />
Lamarck<br />
12%<br />
Halle aux Farines<br />
17%<br />
Lavoisier<br />
10%<br />
Buffon<br />
15%<br />
Condorcet<br />
19%<br />
Grands Moulins<br />
27%<br />
Figure 24 : Répartition <strong>de</strong>s émissions liées à l’immobilisation <strong>de</strong>s bâtiments <strong>de</strong> <strong>Paris</strong> Rive Gauche<br />
46 Université <strong>Paris</strong> Di<strong>de</strong>rot – <strong>Paris</strong> 7 <strong>Paris</strong> Di<strong>de</strong>rot Développement Durable