Rapport Bilan Carbone de l'université Paris Diderot.
Rapport Bilan Carbone de l'université Paris Diderot.
Rapport Bilan Carbone de l'université Paris Diderot.

You also want an ePaper? Increase the reach of your titles
YUMPU automatically turns print PDFs into web optimized ePapers that Google loves.
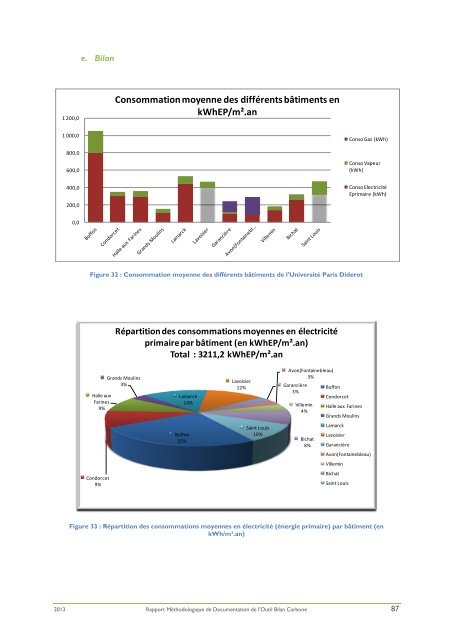
e. <strong>Bilan</strong><br />
1 200,0<br />
Consommation moyenne <strong>de</strong>s différents bâtiments en<br />
kWhEP/m².an<br />
1 000,0<br />
800,0<br />
600,0<br />
Conso Gaz (kWh)<br />
Conso Vapeur<br />
(kWh)<br />
400,0<br />
200,0<br />
Conso Electricité<br />
Eprimaire (kWh)<br />
0,0<br />
Figure 32 : Consommation moyenne <strong>de</strong>s différents bâtiments <strong>de</strong> l'Université <strong>Paris</strong> Di<strong>de</strong>rot<br />
Répartition <strong>de</strong>s consommations moyennes en électricité<br />
primaire par bâtiment (en kWhEP/m².an)<br />
Total : 3211,2 kWhEP/m².an<br />
Halle aux<br />
Farines<br />
9%<br />
Grands Moulins<br />
3%<br />
Lamarck<br />
14%<br />
Lavoisier<br />
12%<br />
Avon(Fontainebleau)<br />
3%<br />
Garancière<br />
3%<br />
Villemin<br />
4%<br />
Buffon<br />
Condorcet<br />
Halle aux Farines<br />
Grands Moulins<br />
Buffon<br />
25%<br />
Saint Louis<br />
10%<br />
Bichat<br />
8%<br />
Lamarck<br />
Lavoisier<br />
Garancière<br />
Avon(Fontainebleau)<br />
Villemin<br />
Condorcet<br />
9%<br />
Bichat<br />
Saint Louis<br />
Figure 33 : Répartition <strong>de</strong>s consommations moyennes en électricité (énergie primaire) par bâtiment (en<br />
kWh/m².an)<br />
2013 <strong>Rapport</strong> Méthodologique <strong>de</strong> Documentation <strong>de</strong> l’Outil <strong>Bilan</strong> <strong>Carbone</strong> 87