Rapport Bilan Carbone de l'université Paris Diderot.
Rapport Bilan Carbone de l'université Paris Diderot.
Rapport Bilan Carbone de l'université Paris Diderot.

Create successful ePaper yourself
Turn your PDF publications into a flip-book with our unique Google optimized e-Paper software.
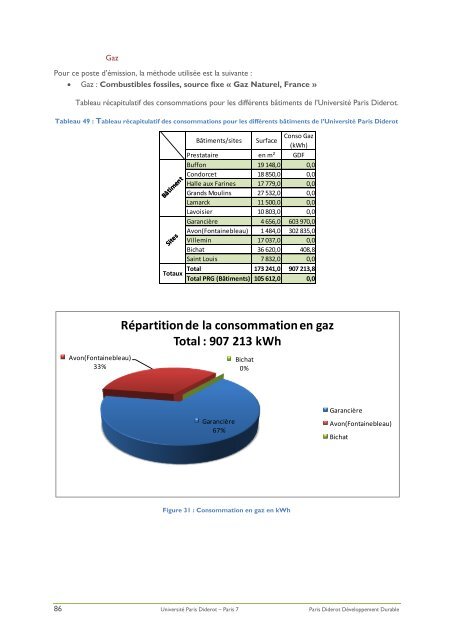
Gaz<br />
Pour ce poste d’émission, la métho<strong>de</strong> utilisée est la suivante :<br />
Gaz : Combustibles fossiles, source fixe « Gaz Naturel, France »<br />
Tableau récapitulatif <strong>de</strong>s consommations pour les différents bâtiments <strong>de</strong> l’Université <strong>Paris</strong> Di<strong>de</strong>rot.<br />
Tableau 49 : Tableau récapitulatif <strong>de</strong>s consommations pour les différents bâtiments <strong>de</strong> l’Université <strong>Paris</strong> Di<strong>de</strong>rot<br />
Bâtiment<br />
Sites<br />
Totaux<br />
Bâtiments/sites Surface<br />
Conso Gaz<br />
(kWh)<br />
Prestataire en m² GDF<br />
Buffon 19 148,0 0,0<br />
Condorcet 18 850,0 0,0<br />
Halle aux Farines 17 779,0 0,0<br />
Grands Moulins 27 532,0 0,0<br />
Lamarck 11 500,0 0,0<br />
Lavoisier 10 803,0 0,0<br />
Garancière 4 656,0 603 970,0<br />
Avon(Fontainebleau) 1 484,0 302 835,0<br />
Villemin 17 037,0 0,0<br />
Bichat 36 620,0 408,8<br />
Saint Louis 7 832,0 0,0<br />
Total 173 241,0 907 213,8<br />
Total PRG (Bâtiments) 105 612,0 0,0<br />
Répartition <strong>de</strong> la consommation en gaz<br />
Total : 907 213 kWh<br />
Avon(Fontainebleau)<br />
33%<br />
Bichat<br />
0%<br />
Garancière<br />
Garancière<br />
67%<br />
Avon(Fontainebleau)<br />
Bichat<br />
Figure 31 : Consommation en gaz en kWh<br />
86 Université <strong>Paris</strong> Di<strong>de</strong>rot – <strong>Paris</strong> 7 <strong>Paris</strong> Di<strong>de</strong>rot Développement Durable