T. P. Traitement du Signal Maîtrise E.E.A. - LASC
T. P. Traitement du Signal Maîtrise E.E.A. - LASC
T. P. Traitement du Signal Maîtrise E.E.A. - LASC

Create successful ePaper yourself
Turn your PDF publications into a flip-book with our unique Google optimized e-Paper software.
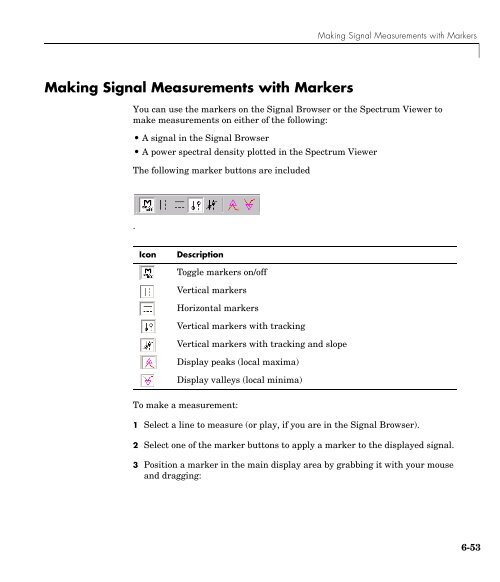
Making <strong>Signal</strong> Measurements with Markers<br />
Making <strong>Signal</strong> Measurements with Markers<br />
You can use the markers on the <strong>Signal</strong> Browser or the Spectrum Viewer to<br />
make measurements on either of the following:<br />
• A signal in the <strong>Signal</strong> Browser<br />
• A power spectral density plotted in the Spectrum Viewer<br />
The following marker buttons are included<br />
.<br />
Icon<br />
Description<br />
Toggle markers on/off<br />
Vertical markers<br />
Horizontal markers<br />
Vertical markers with tracking<br />
Vertical markers with tracking and slope<br />
Display peaks (local maxima)<br />
Display valleys (local minima)<br />
To make a measurement:<br />
1 Select a line to measure (or play, if you are in the <strong>Signal</strong> Browser).<br />
2 Select one of the marker buttons to apply a marker to the displayed signal.<br />
3 Position a marker in the main display area by grabbing it with your mouse<br />
and dragging:<br />
6-53