T. P. Traitement du Signal Maîtrise E.E.A. - LASC
T. P. Traitement du Signal Maîtrise E.E.A. - LASC
T. P. Traitement du Signal Maîtrise E.E.A. - LASC
You also want an ePaper? Increase the reach of your titles
YUMPU automatically turns print PDFs into web optimized ePapers that Google loves.
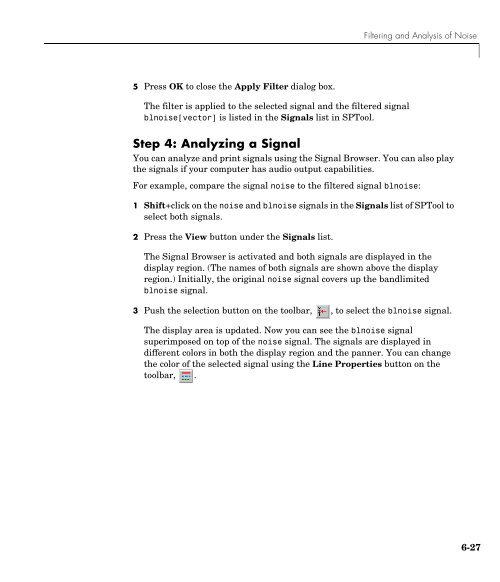
Filtering and Analysis of Noise<br />
5 Press OK to close the Apply Filter dialog box.<br />
The filter is applied to the selected signal and the filtered signal<br />
blnoise[vector] is listed in the <strong>Signal</strong>s list in SPTool.<br />
Step 4: Analyzing a <strong>Signal</strong><br />
You can analyze and print signals using the <strong>Signal</strong> Browser. You can also play<br />
the signals if your computer has audio output capabilities.<br />
For example, compare the signal noise to the filtered signal blnoise:<br />
1 Shift+click on the noise and blnoise signals in the <strong>Signal</strong>s list of SPTool to<br />
select both signals.<br />
2 Press the View button under the <strong>Signal</strong>s list.<br />
The <strong>Signal</strong> Browser is activated and both signals are displayed in the<br />
display region. (The names of both signals are shown above the display<br />
region.) Initially, the original noise signal covers up the bandlimited<br />
blnoise signal.<br />
3 Push the selection button on the toolbar, , to select the blnoise signal.<br />
The display area is updated. Now you can see the blnoise signal<br />
superimposed on top of the noise signal. The signals are displayed in<br />
different colors in both the display region and the panner. You can change<br />
the color of the selected signal using the Line Properties button on the<br />
toolbar, .<br />
6-27


