2. Profilo aziendale - Azienda Ospedaliera di Parma
2. Profilo aziendale - Azienda Ospedaliera di Parma
2. Profilo aziendale - Azienda Ospedaliera di Parma

Create successful ePaper yourself
Turn your PDF publications into a flip-book with our unique Google optimized e-Paper software.
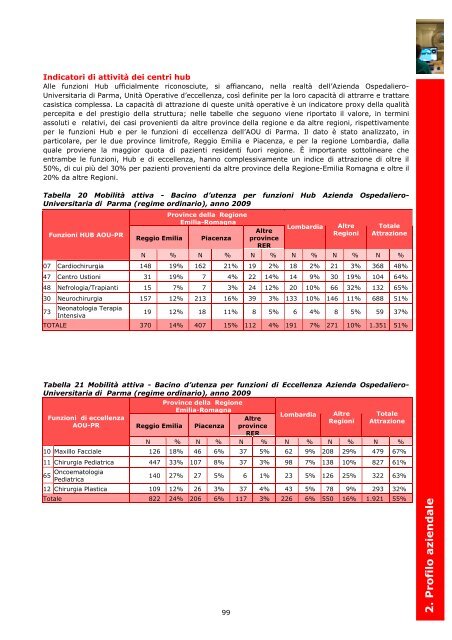
In<strong>di</strong>catori <strong>di</strong> attività dei centri hub<br />
Alle funzioni Hub ufficialmente riconosciute, si affiancano, nella realtà dell’<strong>Azienda</strong> Ospedaliero-<br />
Universitaria <strong>di</strong> <strong>Parma</strong>, Unità Operative d’eccellenza, così definite per la loro capacità <strong>di</strong> attrarre e trattare<br />
casistica complessa. La capacità <strong>di</strong> attrazione <strong>di</strong> queste unità operative è un in<strong>di</strong>catore proxy della qualità<br />
percepita e del prestigio della struttura; nelle tabelle che seguono viene riportato il valore, in termini<br />
assoluti e relativi, dei casi provenienti da altre province della regione e da altre regioni, rispettivamente<br />
per le funzioni Hub e per le funzioni <strong>di</strong> eccellenza dell’AOU <strong>di</strong> <strong>Parma</strong>. Il dato è stato analizzato, in<br />
particolare, per le due province limitrofe, Reggio Emilia e Piacenza, e per la regione Lombar<strong>di</strong>a, dalla<br />
quale proviene la maggior quota <strong>di</strong> pazienti residenti fuori regione. È importante sottolineare che<br />
entrambe le funzioni, Hub e <strong>di</strong> eccellenza, hanno complessivamente un in<strong>di</strong>ce <strong>di</strong> attrazione <strong>di</strong> oltre il<br />
50%, <strong>di</strong> cui più del 30% per pazienti provenienti da altre province della Regione-Emilia Romagna e oltre il<br />
20% da altre Regioni.<br />
Tabella 20 Mobilità attiva - Bacino d’utenza per funzioni Hub <strong>Azienda</strong> Ospedaliero-<br />
Universitaria <strong>di</strong> <strong>Parma</strong> (regime or<strong>di</strong>nario), anno 2009<br />
Funzioni HUB AOU-PR<br />
Province della Regione<br />
Emilia-Romagna<br />
Reggio Emilia Piacenza<br />
99<br />
Altre<br />
province<br />
RER<br />
Lombar<strong>di</strong>a<br />
Altre<br />
Regioni<br />
Totale<br />
Attrazione<br />
N % N % N % N % N % N %<br />
07 Car<strong>di</strong>ochirurgia 148 19% 162 21% 19 2% 18 2% 21 3% 368 48%<br />
47 Centro Ustioni 31 19% 7 4% 22 14% 14 9% 30 19% 104 64%<br />
48 Nefrologia/Trapianti 15 7% 7 3% 24 12% 20 10% 66 32% 132 65%<br />
30 Neurochirurgia 157 12% 213 16% 39 3% 133 10% 146 11% 688 51%<br />
Neonatologia Terapia<br />
73<br />
Intensiva<br />
19 12% 18 11% 8 5% 6 4% 8 5% 59 37%<br />
TOTALE 370 14% 407 15% 112 4% 191 7% 271 10% 1.351 51%<br />
Tabella 21 Mobilità attiva - Bacino d’utenza per funzioni <strong>di</strong> Eccellenza <strong>Azienda</strong> Ospedaliero-<br />
Universitaria <strong>di</strong> <strong>Parma</strong> (regime or<strong>di</strong>nario), anno 2009<br />
Funzioni <strong>di</strong> eccellenza<br />
AOU-PR<br />
Province della Regione<br />
Emilia-Romagna<br />
Altre<br />
Reggio Emilia Piacenza province<br />
RER<br />
Lombar<strong>di</strong>a<br />
Altre<br />
Regioni<br />
Totale<br />
Attrazione<br />
N % N % N % N % N % N %<br />
10 Maxillo Facciale 126 18% 46 6% 37 5% 62 9% 208 29% 479 67%<br />
11 Chirurgia Pe<strong>di</strong>atrica 447 33% 107 8% 37 3% 98 7% 138 10% 827 61%<br />
65 Oncoematologia<br />
Pe<strong>di</strong>atrica<br />
140 27% 27 5% 6 1% 23 5% 126 25% 322 63%<br />
12 Chirurgia Plastica 109 12% 26 3% 37 4% 43 5% 78 9% 293 32%<br />
Totale 822 24% 206 6% 117 3% 226 6% 550 16% 1.921 55%<br />
<strong>2.</strong> <strong>Profilo</strong> <strong>aziendale</strong>