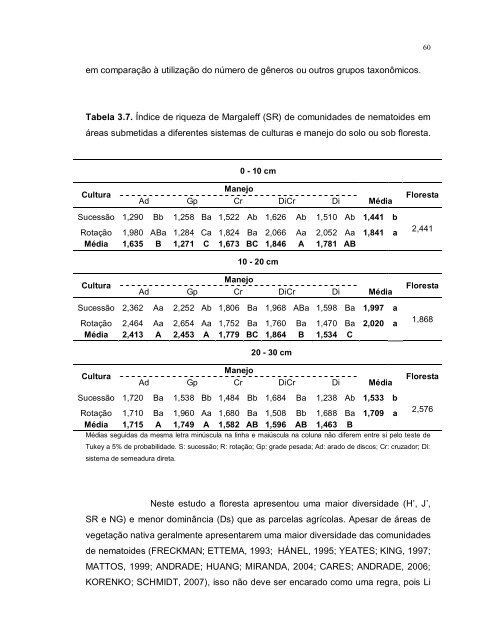
60<strong>em</strong> comparação à utilização do número <strong>de</strong> gêneros ou outros grupos taxonômicos.Tabela 3.7. Índice <strong>de</strong> riqueza <strong>de</strong> Margaleff (SR) <strong>de</strong> comunida<strong>de</strong>s <strong>de</strong> n<strong>em</strong>atoi<strong>de</strong>s <strong>em</strong>áreas submetidas a diferentes sist<strong>em</strong>as <strong>de</strong> <strong>culturas</strong> e manejo do solo ou sob floresta.0 - 10 cmCulturaManejoAd Gp Cr DiCr Di MédiaSucessão 1,290 Bb 1,258 Ba 1,522 Ab 1,626 Ab 1,510 Ab 1,441 bRotação 1,980 ABa 1,284 Ca 1,824 Ba 2,066 Aa 2,052 Aa 1,841 aMédia 1,635 B 1,271 C 1,673 BC 1,846 A 1,781 ABFloresta2,44110 - 20 cmCulturaManejoAd Gp Cr DiCr Di MédiaSucessão 2,362 Aa 2,252 Ab 1,806 Ba 1,968 ABa 1,598 Ba 1,997 aRotação 2,464 Aa 2,654 Aa 1,752 Ba 1,760 Ba 1,470 Ba 2,020 aMédia 2,413 A 2,453 A 1,779 BC 1,864 B 1,534 CFloresta1,868CulturaManejo20 - 30 cmAd Gp Cr DiCr Di MédiaFlorestaSucessão 1,720 Ba 1,538 Bb 1,484 Bb 1,684 Ba 1,238 Ab 1,533 bRotação 1,710 Ba 1,960 Aa 1,680 Ba 1,508 Bb 1,688 Ba 1,709 a2,576Média 1,715 A 1,749 A 1,582 AB 1,596 AB 1,463 BMédias seguidas da mesma letra minúscula na linha e maiúscula na coluna não difer<strong>em</strong> entre si pelo teste <strong>de</strong>Tukey a 5% <strong>de</strong> probabilida<strong>de</strong>. S: sucessão; R: rotação; Gp: gra<strong>de</strong> pesada; Ad: arado <strong>de</strong> discos; Cr: cruzador; Di:sist<strong>em</strong>a <strong>de</strong> s<strong>em</strong>eadura direta.Neste estudo a floresta apresentou uma maior <strong>diversida<strong>de</strong></strong> (H’, J’,SR e NG) e menor dominância (Ds) que as parcelas agrícolas. Apesar <strong>de</strong> áreas <strong>de</strong>vegetação nativa geralmente apresentar<strong>em</strong> uma maior <strong>diversida<strong>de</strong></strong> das comunida<strong>de</strong>s<strong>de</strong> n<strong>em</strong>atoi<strong>de</strong>s (FRECKMAN; ETTEMA, 1993; HÁNEL, 1995; YEATES; KING, 1997;MATTOS, 1999; ANDRADE; HUANG; MIRANDA, 2004; CARES; ANDRADE, 2006;KORENKO; SCHMIDT, 2007), isso não <strong>de</strong>ve ser encarado como uma regra, pois Li
61et al. (2007) encontrou um número superior <strong>de</strong> gêneros <strong>em</strong> áreas <strong>de</strong> plantação <strong>de</strong>chá, <strong>em</strong> comparação com áreas nativas <strong>de</strong> pastagens ou arbustos, na China.Embora, Valocká, Sabovà e Renco (2001), <strong>em</strong> trabalho realizado naEslováquia, tenham observado valores superiores para riqueza <strong>em</strong> áreas <strong>de</strong> cultivosanuais, <strong>em</strong> diversos trabalhos realizados no Brasil observou-se maior <strong>diversida<strong>de</strong></strong>nas áreas <strong>de</strong> vegetação nativa (MATTOS, 1999; ANDRADE; HUANG; MIRANDA,2004; OU et al., 2005; CARES; ANDRADE, 2006; TOMAZINI; FERRAZ;MONTEIRO, 2008a).Tabela 3.8. Índice <strong>de</strong> dominância <strong>de</strong> Simpson (Ds) <strong>de</strong> comunida<strong>de</strong>s <strong>de</strong> n<strong>em</strong>atoi<strong>de</strong>s<strong>em</strong> áreas submetidas a diferentes sist<strong>em</strong>as <strong>de</strong> <strong>culturas</strong> e manejo do solo ou sobfloresta.0 - 10 cmCulturaManejoAd Gp Cr DiCr Di MédiaSucessão 0,361 Aa 0,218 BCa 0,178 CDa 0,151 Da 0,246 Ba 0,234 aRotação 0,208 ABb 0,264 Aa 0,142 Ca 0,108 Ca 0,172 BCb 0,178 bMédia 0,284 A 0,241 AB 0,159 C 0,129 C 0,209 BFloresta0,13010 - 20 cmCulturaManejoAd Gp Cr DiCr Di MédiaSucessão 0,164 Bb 0,174 Ba 0,166 Ba 0,252 Aba 0,266 Aa 0,204 aRotação 0,260 Aa 0,202 Aa 0,206 Aa 0,200 Aa 0,204 Aa 0,214 aMédia 0,212 A 0,188 A 0,186 A 0,226 A 0,235 AFloresta0,132Cultura20 - 30 cmManejoAd Gp Cr DiCr Di MédiaFlorestaSucessão 0,152 Ba0,164 Ba 0,152 Ba 0,276 Aa 0,177 a0,142 BaRotação 0,144 ABa0,1240,128 ABa 0,112 Bb 0,156 Aa 0,114 Bb 0,131 bMédia 0,148 B 0,135 B 0,138 B 0,154 B 0,195 AMédias seguidas da mesma letra minúscula na linha e maiúscula na coluna não difer<strong>em</strong> entre si pelo teste <strong>de</strong>Tukey a 5% <strong>de</strong> probabilida<strong>de</strong>. S: sucessão; R: rotação; Gp: gra<strong>de</strong> pesada; Ad: arado <strong>de</strong> discos; Cr: cruzador; Di:sist<strong>em</strong>a <strong>de</strong> s<strong>em</strong>eadura direta.
- Page 2 and 3:
GIOVANI DE OLIVEIRA ARIEIRADIVERSID
- Page 4 and 5:
GIOVANI DE OLIVEIRA ARIEIRADIVERSID
- Page 6 and 7:
AGRADECIMENTOSAgradeço primeiramen
- Page 8 and 9:
What gets us into trouble is not wh
- Page 10 and 11:
ARIEIRA, Giovani de Oliveira. Nemat
- Page 12 and 13: LISTA DE TABELASTabela 2.1 Hábitos
- Page 14 and 15: SUMÁRIO1 INTRODUÇÃO ............
- Page 16 and 17: 14em sistemas agrícolas. São orga
- Page 18 and 19: 16hipóteses ecológicas sobre porq
- Page 20 and 21: 18de leguminosas por Rhizobium sp.,
- Page 22 and 23: 20crescimento microbiano; nematoide
- Page 24 and 25: 222.1.4 Nematoides de vida livreOs
- Page 26 and 27: 24b) DiversidadeUma primeira medida
- Page 28 and 29: 26baseado na sua taxa de reproduç
- Page 30 and 31: 28os valores c-p das famílias de n
- Page 32 and 33: 30BONGERS, 1999).Se a primeira etap
- Page 34 and 35: 32representam enriquecimento, estru
- Page 36 and 37: 342.2 MANEJO DOS SOLOSO solo é um
- Page 38 and 39: 36(SILVA et al., 2005).2.3.1 Prepar
- Page 40 and 41: 38crescente, tanto por parte dos pe
- Page 42 and 43: 40Stone e Silveira (2001) também a
- Page 44 and 45: 423. ARTIGO A: DIVERSIDADE TAXONÔM
- Page 46 and 47: 44abundances occurred in the topsoi
- Page 48 and 49: 46rotação de culturas incluindo c
- Page 50 and 51: 48perfil do solo é afetada pelo us
- Page 52 and 53: 50Tabela 3.2. Abundância relativa
- Page 54 and 55: 52Nas áreas de rotação, também
- Page 56 and 57: 54Entre as parcelas agrícolas, hou
- Page 58 and 59: 56no sistems DiCr em rotação de c
- Page 60 and 61: 58sistemas DiCr e Di, ambos em rota
- Page 64 and 65: 62Em relação aos efeitos dos cult
- Page 66 and 67: 64com baixa ocorrência de nematoid
- Page 68 and 69: 66do solo, assim como a disponibili
- Page 70 and 71: 68Tukey a 5% de significância foi
- Page 72 and 73: 70partir de 10cm. Isso pode ser jus
- Page 74 and 75: 72Considerando-se os índices utili
- Page 76 and 77: 74Tabela 4.4. Índice de Parasitas
- Page 78 and 79: 76Figura 4.2. Perfil faunal (EI X S
- Page 80 and 81: 78Figura 4.3. Análise de Component
- Page 82 and 83: 80Figura 4.4. Análise de Agrupamen
- Page 84 and 85: 825 CONCLUSÕES GERAISOs nematoides
- Page 86 and 87: 84BAUDER, J.W.; RANDAL, G.W.; SWAN,
- Page 88 and 89: 86DE GOEDE, R.G.M.; VAN DIJK, T.S.
- Page 90 and 91: 88GOSECO, C.G.; FERRIS, V.R.; FERRI
- Page 92 and 93: 90MANACHINI, B.; CORSINI, A.; BOCCH
- Page 95 and 96: 93STONE, L.F.; SILVEIRA, P.M. Efeit
- Page 97 and 98: YEATES, G.W. Effects of plants on n
- Page 99 and 100: 97ANEXO AVegetaçãonativaParcelasa