2013_172 - Feuerwehrbedarfsplan 2013 - Stadt Weimar
2013_172 - Feuerwehrbedarfsplan 2013 - Stadt Weimar
2013_172 - Feuerwehrbedarfsplan 2013 - Stadt Weimar

Erfolgreiche ePaper selbst erstellen
Machen Sie aus Ihren PDF Publikationen ein blätterbares Flipbook mit unserer einzigartigen Google optimierten e-Paper Software.
sonstige<br />
Hilfe<br />
Brand<br />
Anzahl Gesamt<br />
Prozent<br />
Hilfe<br />
Brand<br />
Anzahl Gesamt<br />
Prozent<br />
Gesamteinsatzzahl<br />
Prozent<br />
<strong>Stadt</strong> <strong>Weimar</strong><br />
<strong>Feuerwehrbedarfsplan</strong><br />
Abbildung 13: Tagesverlauf Brandschutz 2012<br />
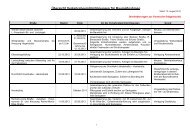
2.5.3 Territoriale Verteilung der Einsätze<br />
Der nachfolgende Abschnitt erörtert, auf Grundlage der Einsatzzahlen der Jahre 2011 und<br />
2012, die örtlichen Einsatzschwerpunkte in der <strong>Stadt</strong> in Bezug auf die statistischen Bezirke.<br />
2011 2012<br />
Nr.<br />
Statistischer Bezirk<br />
11 Altstadt 118 66 184 18,11 114 95 209 19,51 393 18,83<br />
12 Westvorstadt 39 27 66 6,50 30 19 49 4,58 115 5,51<br />
13 Nordvorstadt 68 20 88 8,66 91 24 115 10,74 203 9,73<br />
21 Nordstadt 67 18 85 8,37 88 16 104 9,71 189 9,06<br />
22 Industriegebiet Nord 42 20 62 6,10 62 34 96 8,96 158 7,57<br />
23 Schöndorf 53 12 65 6,40 59 7 66 6,16 131 6,28<br />
31 Parkvorstadt 16 13 29 2,85 26 18 44 4,11 73 3,50<br />
32 Oberw eimar/Ehringsdorf 55 24 79 7,78 50 14 64 5,98 143 6,85<br />
33 Taubach 4 0 4 0,39 2 0 2 0,19 6 0,29<br />
34 Süßenborn 3 0 3 0,30 0 2 2 0,19 5 0,24<br />
35 Tiefurt 2 0 2 0,20 8 0 8 0,75 10 0,48<br />
41 Südstadt 29 17 46 4,53 36 12 48 4,48 94 4,50<br />
42 Schönblick 49 11 60 5,91 41 14 55 5,14 115 5,51<br />
43 Niedergrunstedt 6 0 6 0,59 2 1 3 0,28 9 0,43<br />
44 Gelmeroda 3 2 5 0,49 1 0 1 0,09 6 0,29<br />
45 Possendorf 2 0 2 0,20 2 2 4 0,37 6 0,29<br />
46 Legefeld 13 2 15 1,48 10 2 12 1,12 27 1,29<br />
51 Industriegebiet West 42 11 53 5,22 28 17 45 4,20 98 4,70<br />
52 Weststadt 49 20 69 6,79 63 21 84 7,84 153 7,33<br />
53 Tröbsdorf 14 6 20 1,97 9 2 11 1,03 31 1,49<br />
54 Gaberndorf 6 0 6 0,59 7 0 7 0,65 13 0,62<br />
UNO 5 10 15 1,48 4 2 6 0,56 21 1,01<br />
BAB 4 <strong>Stadt</strong> 7 1 8 0,79 5 1 6 0,56 14 0,67<br />
BAB 4 Land 20 6 26 2,56 4 3 7 0,65 33 1,58<br />
Landkreis 4 5 9 0,89 9 7 16 1,49 25 1,20<br />
B 7 4 1 5 0,49 5 0 5 0,47 10 0,48<br />
B 85 2 2 4 0,39 1 1 2 0,19 6 0,29<br />
Brandsicherheitsw achen 67 67 182 182 249<br />
ges. Sonstige 109 25 134 13,19 210 14 224 20,92 109 5,22<br />
Gesamt: (ohne BSW) 722 294 1016 100,00 757 314 1071 100 2087 100,00<br />
2011 2012 11/12<br />
Hilfeleistg. Brand Gesamt % Hilfeleistg. Brand Gesamt % Einsätze %<br />
gering 5 3 8 5%<br />
Tabelle 4: Territoriale Verteilung der Einsätze<br />
Seite 34 von 90