HANSA 01-2021
Hull Performance & Coating · Svitzer · Yacht »Soaring« · Schifffahrtsaktien & Börsen · Harren & Partner · LNG in der Schulte-Gruppe · Berenberg Bank · Schiffsinspektionen
Hull Performance & Coating · Svitzer · Yacht »Soaring« · Schifffahrtsaktien & Börsen · Harren & Partner · LNG in der Schulte-Gruppe · Berenberg Bank · Schiffsinspektionen

Erfolgreiche ePaper selbst erstellen
Machen Sie aus Ihren PDF Publikationen ein blätterbares Flipbook mit unserer einzigartigen Google optimierten e-Paper Software.
SCHiFFStECHNiK | SHiP tECHNoloGY<br />
A hybrid hull performance prediction<br />
Finnish technology company Wärtsilä Voyage developed a new model for predicting hull<br />
performance that could improve accuracy while keeping costs low enough to make the<br />
system viable fleetwide<br />
The topic »fusion of high-frequency<br />
navigational data and noon-reported<br />
data to predict hull condition«<br />
was presented and discussed during recent<br />
Hull Performance & insight Conference<br />
2020.<br />
accurately predicting the impact of<br />
hull condition on vessel performance allows<br />
ship operators to better understand<br />
and reduce their fuel consumption. But<br />
typical methods of predicting hull performance<br />
are far from ideal. our paper<br />
explained how a new model for predicting<br />
hull performance had been developed<br />
and verified that could improve accuracy<br />
while keeping costs low enough to<br />
make the system viable fleetwide.<br />
Hull performance predictions are<br />
typically based either on high-frequency,<br />
sensor-based data or low-frequency<br />
noon report data. Methods using sensor<br />
data are more accurate but are expensive<br />
because they must be tailored<br />
to each vessel and sensors require calibration.<br />
Noon report-based methods can be<br />
more easily implemented but are less<br />
accurate due to averaging of inevitable<br />
changes in speed, weather and other<br />
factors between reporting intervals.<br />
Wärtsilä Voyage’s third way combines<br />
high-frequency data available through<br />
standardised navigation equipment (such<br />
as ECdiS) with noon reports and data<br />
from third-party sources. By applying machine<br />
learning to these data sources, this<br />
approach achieves data quality similar to<br />
high-frequency data logging, but with low<br />
capital and operational costs comparable<br />
with noon report-based logging.<br />
Aggregation error<br />
Hull performance prediction can suffer<br />
from errors in measuring, modelling,<br />
implementation or statistical analysis.<br />
one significant statistical source of error<br />
is introduced when basing hull performance<br />
model calculations on noon<br />
report data. Noon report data provides<br />
average readings of various variables<br />
affecting vessel performance, including<br />
speed, fuel consumption and weather.<br />
But these factors are rarely consistent<br />
across a day. The more they fluctuate,<br />
the less accurate the averaged readings<br />
are and the greater the statistical error<br />
that is introduced into the readings and<br />
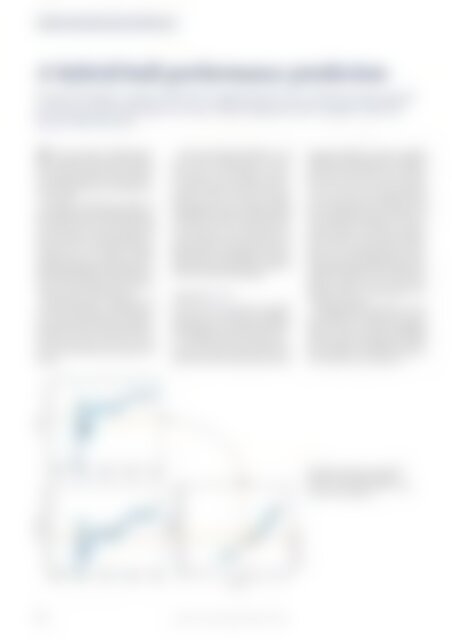
any subsequent calculations. as an example,<br />
the charts on the left in the figure<br />
shows timeline for speed and consumption<br />
for non-constant speed operation.<br />
Blue dots mark the high-frequency data.<br />
The average and standard deviation are<br />
plotted as orange lines. The speed-consumption<br />
graph is given on the right,<br />
plotting speed and aggregated consumption<br />
in orange.<br />
The aggregated consumption lies significantly<br />
above the high-frequency data<br />
points. This error is known as aggregation<br />
error. When variables have changed<br />
often throughout the aggregation period,<br />
this can lead to a deviation of as much as<br />
30% from the true consumption.<br />
A timeline for speed and consumption.<br />
Blue dots mark the high-frequency<br />
data. The average and standard deviation<br />
are plotted as orange lines<br />
© Wärtsilä Voyage<br />
48 HaNSa – international Maritime Journal <strong>01</strong> | <strong>2021</strong>