- Page 1 and 2:
MARCEL DEKKER Handbook of Size Excl
- Page 3 and 4:
CHROMATOGRAPHIC SCIENCE SERIES A Se
- Page 5 and 6:
60. Modern Chromatographic Analysis
- Page 7 and 8:
Preface to the Second Edition Gel p
- Page 9 and 10:
Preface to the First Edition Molecu
- Page 11 and 12:
Contents Preface to the Second Edit
- Page 13 and 14:
17. Size Exclusion Chromatography o
- Page 15 and 16:
James F. Curry Analytical Departmen
- Page 17 and 18:
Iwao Teraoka, Ph.D. Othmer Departme
- Page 19 and 20:
The graphical data display typicall
- Page 21 and 22:
polymer molecule can elute. The tot
- Page 23 and 24:
individual states) allowed to them.
- Page 25 and 26:
unsaturation while the IR detector
- Page 27 and 28:
Sampleconcentrationshouldbeminimize
- Page 29 and 30:
averagesdefinedintermsofthemolecula
- Page 31 and 32:
information regarding appropriate M
- Page 33 and 34:
Analytical. Two models, the KMX-6 a
- Page 35 and 36:
Figure 6 Overlay of time-sliced pea
- Page 37 and 38:
accurately for very large and very
- Page 39 and 40:
4 GENERAL REFERENCES The interested
- Page 41 and 42:
46. TA Chamberlin, HE Tuinstra. US
- Page 43 and 44:
materials are commercially availabl
- Page 45 and 46:
Table 1 Commercial Column Packing M
- Page 47 and 48:
necessarily comparable. For this re
- Page 49 and 50:
adjusted such that the pore size di
- Page 51 and 52:
narrowmolecular weight range, indiv
- Page 53 and 54:
Figure 8 Effect of particle size on
- Page 55 and 56:
Figure 9 SEC calibration using poly
- Page 57 and 58:
Table 4 Typical Eluent Systems for
- Page 59 and 60:
Figure 12 Analysis of poly-2-vinyl
- Page 61 and 62:
24. E Meehan, S O’Donohue. The ro
- Page 63 and 64:
into accepted laboratory techniques
- Page 65 and 66:
Table 1 Trace Metal Impurities in C
- Page 67 and 68:
mass and biological activity, for m
- Page 69 and 70:
Experimental efficiency vs. velocit
- Page 71 and 72:
Table 3 Properties of SEC Silica Ge
- Page 73 and 74:
operate at aflow rate that can easi
- Page 75 and 76:
Figure 3 Efficiency of amide-bonded
- Page 77 and 78:
mechanically stable packing materia
- Page 79 and 80:
Figure 5 Pore size distributions of
- Page 81 and 82:
Figure 6 Separation of polystyrenes
- Page 83 and 84:
60-120 A ˚ are large enough to be
- Page 85 and 86:
Table 6 Selected Silica-Based Colum
- Page 87 and 88:
Table 7 Separation Ranges for Polym
- Page 89 and 90:
the decline in permeability is perm
- Page 91 and 92:
sample components can be varied by
- Page 93 and 94:
Figure 10 Diol bonding reactions. I
- Page 95 and 96:
ecause of the higher relative molec
- Page 97 and 98:
valuesfork1,k2,anda,theunknownmolec
- Page 99 and 100:
water-soluble and detergent-soluble
- Page 101 and 102:
the importance of secondary retenti
- Page 103 and 104:
discussed in Table 8(33). Based on
- Page 105 and 106:
individual dispersion processes ins
- Page 107 and 108:
The detector time constant can dist
- Page 109 and 110:
5.3 Mobile Phase A mobile phase is
- Page 111 and 112:
less steep and still linear at high
- Page 113 and 114:
35. P Bristow, J Knox. Chromatograp
- Page 115 and 116:
112. K Gooding, K Lu, G Vanecek, F
- Page 117 and 118:
for branched polymers or copolymers
- Page 119 and 120:
Figure 1 “Bridge design” flow-r
- Page 121 and 122:
Figure 3 A light-scattering photome
- Page 123 and 124:
Figure 5 SEC universal calibration
- Page 125 and 126:
where hn is the hydrodynamic volume
- Page 127 and 128:
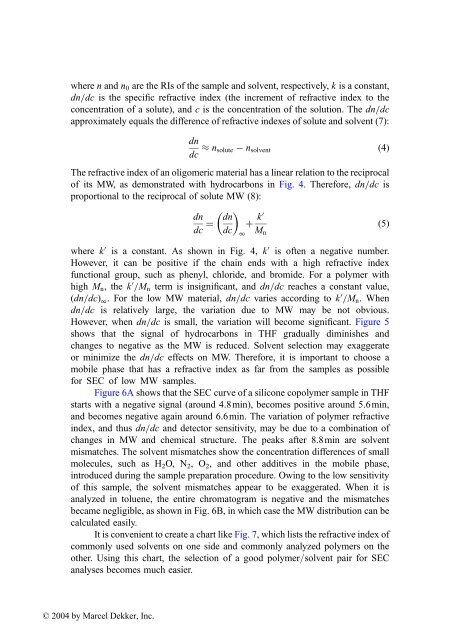
It should be noted that dn=dc also
- Page 129 and 130:
sensitivity for many samples compar
- Page 131 and 132:
that is, log[h] vs. logM,generated
- Page 133 and 134:
Figure 8 Effect of band broadening
- Page 135 and 136:
Table 1 Measurement of Molecular We
- Page 137 and 138:
Figure 10 Differential refractomete
- Page 139 and 140:
Figure 11 (A) Mark-Houwink plot of
- Page 141 and 142:
Table 3 Measurement of Molecular We
- Page 143 and 144:
size information is derived from un
- Page 145 and 146:
Table 5 Molecular Weight Distributi
- Page 147 and 148:
By measuring the scattered intensit
- Page 149 and 150:
8 APPENDIX: INSTRUMENT COMPANIES 8.
- Page 151 and 152:
53. G Marot, J Lesec. J Liq Chromat
- Page 153 and 154:
125. D Slootmaekers, JAPP Van Dijk,
- Page 155 and 156:
200. JG Bindels, GJJ Bessems, BM De
- Page 157 and 158:
possibly with hydrodynamic volume (
- Page 159 and 160:
An insurmountable limitation of SEC
- Page 161 and 162:
to sDR(V) when either nPS ¼nPB ¼c
- Page 163 and 164:
1,4-trans;and8%1,2-vynil.TheglobalC
- Page 165 and 166:
The goal is to find the MWD and CCD
- Page 167 and 168:
As expected, pS is closer to the no
- Page 169 and 170:
Figure 3 Example 3: MWD and BD of a
- Page 171 and 172:
9. BH Zimm, WH Stockmayer. The dime
- Page 173 and 174:
45. RO Bielsa, GR Meira. Linear cop
- Page 175 and 176:
solubility properties. They are use
- Page 177 and 178:
determination of the absolute molec
- Page 179 and 180:
Figure 4 Result of the PBT analysis
- Page 181 and 182:
Figure 8 Result of natural spider s
- Page 183 and 184:
7 Size Exclusion Chromatography of
- Page 185 and 186:
As pointed out earlier, rubber must
- Page 187 and 188:
Table 2 Various Solvents and Operat
- Page 189 and 190:
Figure 2 Typical GPC calibrations w
- Page 191 and 192:
© 2004 by Marcel Dekker, Inc. Figu
- Page 193 and 194:
Natural and Synthetic Rubbe177 vari
- Page 195 and 196:
Another example, shown in Fig. 5 (3
- Page 197 and 198:
APPENDIX: SEC CONDITIONS FOR RUBBER
- Page 199 and 200:
Appendix (Continued) Polymer Column
- Page 201 and 202:
Appendix (Continued) Polymer Column
- Page 203 and 204:
Appendix (Continued) Polymer Column
- Page 205 and 206:
5. J West, E Rodriguez. Rubber Chem
- Page 207 and 208:
8 Size Exclusion Chromatography of
- Page 209 and 210:
associate. Girdler (67) and Speight
- Page 211 and 212:
Table 1 Fractions Obtained Using Co
- Page 213 and 214:
Figure 1 SEC analyses of an aged as
- Page 215 and 216:
Apparently more polar compounds are
- Page 217 and 218:
40% was fractionated into four frac
- Page 219 and 220:
Figure 7 SEC analyses of an unaged
- Page 221 and 222:
Figure 9 Comparison of percentage L
- Page 223 and 224:
Figure 11 Comparison of SEC chromat
- Page 225 and 226:
Figure 12 Comparisons of SEC chroma
- Page 227 and 228:
percentage LMS at the other locatio
- Page 229 and 230:
the total area into up to 12 sectio
- Page 231 and 232:
attempted to develop an SEC method
- Page 233 and 234:
parameterisbasedontheinternalpressu
- Page 235 and 236:
5 MODIFIED ASPHALTS The addition of
- Page 237 and 238:
Oxidation of the rubber and asphalt
- Page 239 and 240:
Figure 20 SEC chromatogram for an a
- Page 241 and 242:
Figure 21 Comparisons of apparent m
- Page 243 and 244:
© 2004 by Marcel Dekker, Inc. S/
- Page 245 and 246:
PS/10 4 þ 10 3 þ 500 þ 100 THF/1
- Page 247 and 248:
Nevertheless, SEC of asphalts is es
- Page 249 and 250:
56. NW Garrick, RR Biskur. Trans Re
- Page 251 and 252:
Asphalts 235 122. M-S Lin, JM Chaff
- Page 253 and 254:
9 Size Exclusion Chromatography of
- Page 255 and 256:
Table 1 Applications of Acrylamide
- Page 257 and 258:
(AM/AA), and acrylamide/dimethyldia
- Page 259 and 260:
polymer, a large size filter of 5,
- Page 261 and 262:
Figure 1 Size exclusion chromatogra
- Page 263 and 264:
Table3 MWandMWDofaBroad-MWDPAMStand
- Page 265 and 266:
Another commercially available MW d
- Page 267 and 268:
Table 5 Weight-Average Molecular We
- Page 269 and 270:
Figure 6 (a) Size exclusion chromat
- Page 271 and 272:
compared to anormal product. By com
- Page 273 and 274:
StudyingtheKineticsofaChemicalReact
- Page 275 and 276:
this information, the higher MW pea
- Page 277 and 278:
Appendix (Continued) Polymer Column
- Page 279 and 280:
Appendix (Continued) Polymer Column
- Page 281 and 282:
46. CJ Kim, A Hamielec, A Bendek. J
- Page 283 and 284:
10 Size Exclusion Chromatography of
- Page 285 and 286:
A relatively new technique utilizin
- Page 287 and 288:
where ais the exponent of the Mark-
- Page 289 and 290:
Figure 2 TDS chromatograms for full
- Page 291 and 292:
Figure 5 Comparison of molecular we
- Page 293 and 294:
Table 3 Summary of TDS Molecular We
- Page 295 and 296:
thepartiallyhydrolyzedPVAwiththecol
- Page 297 and 298:
Table 5 Summary of Conformation and
- Page 299 and 300:
a¼0.627andlog(K) ¼23.249.Theseare
- Page 301 and 302:
The limits of detection of the PVA
- Page 303 and 304:
Figure 12 PVAc broad molecular weig
- Page 305 and 306:
4 SUMMARY Advances in SEC character
- Page 307 and 308:
11 Size Exclusion Chromatography of
- Page 309 and 310:
2.1 Molecular Weight Grades of PVP
- Page 311 and 312:
exclusion chromatography with low-a
- Page 313 and 314:
weightandmolecularweightdistributio
- Page 315 and 316:
© 2004 by Marcel Dekker, Inc. Figu
- Page 317 and 318:
Figure 4 PEOcalibrationofUltrahydro
- Page 319 and 320:
Figure 6 Overlay of GPC chromatogra
- Page 321 and 322:
plus Ultrahydrogel 120 A ˚ ,Shodex
- Page 323 and 324:
Figure 10 SEC traces of PVP/AA copo
- Page 325 and 326:
Figure 11 Molecular weight distribu
- Page 327 and 328:
12 Size Exclusion Chromatography of
- Page 329 and 330:
2 CHEMICAL, MACROMOLECULAR AND MORP
- Page 331 and 332:
Table 2 The Relative Composition of
- Page 333 and 334:
considered to be 3. After the DS ha
- Page 335 and 336:
een extensively studied by methods
- Page 337 and 338:
The silylation was performed in LiC
- Page 339 and 340:
observed using column materials hav
- Page 341 and 342:
Table 6 (Continued) Packing materia
- Page 343 and 344:
4.5 Other Cellulose Derivatives Bes
- Page 345 and 346:
Table 8 SEC Conditions for Characte
- Page 347 and 348:
dextrans swell too much in cadoxen
- Page 349 and 350:
stirring at room temperature for an
- Page 351 and 352:
Figure 2 MMDofunbleached(HP)andblea
- Page 353 and 354:
Figure 4 MMDofbirchkraftpulpdegrade
- Page 355 and 356:
adequate when evaluating the influe
- Page 357 and 358:
differential refractive index (DRI)
- Page 359 and 360:
30. HA Krässig. Effects of structu
- Page 361 and 362:
67. E Sjöholm, K Gustafsson, A Col
- Page 363 and 364:
104. B Fleury, J Dubois, C Léonard
- Page 365 and 366:
136. D Miller, D Senior, R Sutcliff
- Page 367 and 368:
166. SS Cutié, CG Smith. Determina
- Page 369 and 370:
200. R Berggren, F Berthold, E Sjö
- Page 371 and 372:
13 Molar Mass and Size Distribution
- Page 373 and 374:
measurements, and vapor pressure os
- Page 375 and 376:
The calibration of SEC columns by c
- Page 377 and 378:
The division according to eluent ty
- Page 379 and 380:
Apolymer produced by UV irradiation
- Page 381 and 382:
Because DMAC/LiCl is also agood sol
- Page 383 and 384:
compoundsandwasexplainedbyadsorptio
- Page 385 and 386:
isolated lignins because they are e
- Page 387 and 388:
The Separon HEMA and Separon HEMA B
- Page 389 and 390:
Figure 4 GPC elution curves of the
- Page 391 and 392:
liquor is highest throughout the co
- Page 393 and 394:
topological anisotropy in the polym
- Page 395 and 396:
29. M Ristolainen, R Alen, J Knuuti
- Page 397 and 398:
eds. Proc Int Symp 1998. Canton, Pe
- Page 399 and 400:
92. L Jurasek. Towards a three dime
- Page 401 and 402:
Table 1 Selected Industries Connect
- Page 403 and 404:
into C3-metabolites, which then may
- Page 405 and 406:
Table 4 Key Enzymes in the Biosynth
- Page 407 and 408:
Table 5 Cloned Mutants of Starch En
- Page 409 and 410:
Figure 3 Modeled x-ray diffraction
- Page 411 and 412:
In the native environment (plant ce
- Page 413 and 414:
Figure 6 (a) Large starch granules
- Page 415 and 416:
number of branching points); crossl
- Page 417 and 418:
Both absolute approaches are extrao
- Page 419 and 420:
Table 7 (Continued) Approach Experi
- Page 421 and 422:
structures, excluded volumes, and t
- Page 423 and 424:
Figure 10 (a) SEC elution profile o
- Page 425 and 426:
Figure 12 Wheat glucans: DRI elutio
- Page 427 and 428:
Figure 13 Wheat glucans. Normalized
- Page 429 and 430:
Figure 16 Wheat glucan. Normalized
- Page 431 and 432:
Figure 18 Wheat glucan.Elution prof
- Page 433 and 434:
Figure 20 Wheat glucans. Absolute m
- Page 435 and 436:
Figure 22 Wheat glucan. (a) Intrins
- Page 437 and 438:
Figure 24 Wheat PA-glucan. Elution
- Page 439 and 440:
an Ubbelohde-viscometer for concent
- Page 441 and 442:
Rheological investigations of stabi
- Page 443 and 444:
shifts to applied laser light, whic
- Page 445 and 446:
Table 8 Characteristic Parameters f
- Page 447 and 448:
Table 8 (Continued) and H2O. A part
- Page 449 and 450: 10. SG Ball, MHBJ van de Wal, RGF V
- Page 451 and 452: 52. W Praznik, R Beck. J Chromatogr
- Page 453 and 454: 15 Size Exclusion Chromatography of
- Page 455 and 456: 3 PROTEIN PARTITIONING IN SEC 3.1 G
- Page 457 and 458: Figure 1 Plot of Kav vs. log M for
- Page 459 and 460: yconsideringtheproteinsolutestobesp
- Page 461 and 462: globular proteins and selected flex
- Page 463 and 464: silanol groups (52-54); even capped
- Page 465 and 466: most proteins to be maximally stabl
- Page 467 and 468: Figure 4 Chromatograms of BSA and P
- Page 469 and 470: concentrated) steps of protein puri
- Page 471 and 472: Table 3 Characteristics of Dextran-
- Page 473 and 474: preparative SEC. The capabilities o
- Page 475 and 476: 37. GR Noll, N Nagle, JO Baker, DJ
- Page 477 and 478: 16 Size Exclusion Chromatography of
- Page 479 and 480: Figure 2 Separation of total E. col
- Page 481 and 482: Figure 3 Separation of HaeIII-cleav
- Page 483 and 484: The recovery of DNA fragments has b
- Page 485 and 486: Endotoxin should also be removed fr
- Page 487 and 488: Table 3 Best Columns for the Separa
- Page 489 and 490: Figure 10 Dependence of HETP on flo
- Page 491 and 492: Appendix (Continued ) Polymer Colum
- Page 493 and 494: REFERENCES 1. CT Wehr, SR Abbott. J
- Page 495 and 496: MALDI-MS has been applied to determ
- Page 497 and 498: Figure 1 Calibration curvesof SEC c
- Page 499: Figure 3 Chromatograms of epoxy res
- Page 503 and 504: Figure 5 SEC chromatogram of n-alka
- Page 505 and 506: Figure 7 Refractive indexes of comm
- Page 507 and 508: Another detector recently applied i
- Page 509 and 510: Figure 11 Absolute MW calibration p
- Page 511 and 512: Figure 12 Chromatogram of Acrawax C
- Page 513 and 514: 18 Two-Dimensional Liquid Chromatog
- Page 515 and 516: largerispressuredropandresultingexp
- Page 517 and 518: elations between molar masses and s
- Page 519 and 520: Figure 2 (Continued) chapter, one o
- Page 521 and 522: where Nis the column efficiency exp
- Page 523 and 524: composition/architecture/molar mass
- Page 525 and 526: solvent. Here again, solvent-solven
- Page 527 and 528: or repulsive interactions between m
- Page 529 and 530: macromolecules may strongly differ
- Page 531 and 532: temperature. The efficacy of an ads
- Page 533 and 534: however, aliphatic bonded groups ma
- Page 535 and 536: Figure 10 Schematic representation
- Page 537 and 538: packing materials for SEC of synthe
- Page 539 and 540: Quantitative relations between sila
- Page 541 and 542: Both strength and thermodynamic qua
- Page 543 and 544: where Cand Dare constants for apart
- Page 545 and 546: ThisisimportantwhenLCCCisappliedtoc
- Page 547 and 548: Figure 12 Schematic representation
- Page 549 and 550: Figure 14 Schematic representation
- Page 551 and 552:
However, strong adsorption of macro
- Page 553 and 554:
elution step may be sufficient for
- Page 555 and 556:
Figure 16 Block scheme of a full ad
- Page 557 and 558:
processing of 2D-HPLC data. Knowled
- Page 559 and 560:
Figure 20 Set of full retention-elu
- Page 561 and 562:
distributions of complex polymers a
- Page 563 and 564:
constituents were not discriminated
- Page 565 and 566:
(Sec. 7) and therefore they can be
- Page 567 and 568:
2. Identify sample solvents. First
- Page 569 and 570:
1 Segmental interaction energy para
- Page 571 and 572:
58. BG Belenkii. Pure Appl Chem 51:
- Page 573 and 574:
19 Methods and Columns for High-Spe
- Page 575 and 576:
Table 1 Summary of Methods for Incr
- Page 577 and 578:
not savealot of time and solvent, d
- Page 579 and 580:
Figure 3 Conventional SEC chromatog
- Page 581 and 582:
chromatogram at 4mL/min, which is f
- Page 583 and 584:
Sincethereductionoftheinternaldiame
- Page 585 and 586:
Table 3 Summary of Column Performan
- Page 587 and 588:
Figure 11 Dependence of column perf
- Page 589 and 590:
. Two-dimensional chromatography ru
- Page 591 and 592:
The standard deviations for the mol
- Page 593 and 594:
Figure 15 Comparison of time requir
- Page 595 and 596:
Figure 17 Accuracy and precision of
- Page 597 and 598:
polymer analysis. Samples are “ru
- Page 599 and 600:
just ignoring the fractionation of
- Page 601 and 602:
20 Automatic Continuous Mixing Tech
- Page 603 and 604:
out at low enough concentration tha
- Page 605 and 606:
educed viscosity, h r, to be comput
- Page 607 and 608:
© 2004 by Marcel Dekker, Inc. Figu
- Page 609 and 610:
Figure 2 Raw ACOMP signals from mul
- Page 611 and 612:
Figure 4 Mw vs. monomer conversion,
- Page 613 and 614:
decreases smoothly and monotonicall
- Page 615 and 616:
Figure 7 Effects of fluctuating rea
- Page 617 and 618:
Finally, the use of a light-scatter
- Page 619 and 620:
Figure 8 Linear and cubic increases
- Page 621 and 622:
where r(t) is now given by 2 6 r(t)
- Page 623 and 624:
Figure 11 Light scattering from sol
- Page 625 and 626:
3.1 ASimple System: Equilibrium Cha
- Page 627 and 628:
Figure 13 (a) ACM applied to the ch
- Page 629 and 630:
Also of note in Fig. 13b is how hig
- Page 631 and 632:
15. JM Starita, CL Rohn. Rheologica
- Page 633 and 634:
52. M Hulden. Hydrophobically modif
- Page 635 and 636:
21 Light Scattering and the Solutio
- Page 637 and 638:
therefore, is to remove any lingeri
- Page 639 and 640:
is often found in the literature wh
- Page 641 and 642:
Figure 2 Configuration of an SEC se
- Page 643 and 644:
5 THE IMPORTANCE OF SOFTWARE Like a
- Page 645 and 646:
standard deviations of the measured
- Page 647 and 648:
These include the differential weig
- Page 649 and 650:
Figure 8 Data of Fig. 7corrected fo
- Page 651 and 652:
Figure 11 Data of Fig. 10 with spik
- Page 653 and 654:
Figure 13 Fitstodatacollectedatasli
- Page 655 and 656:
Table 1 Errors (in %) Characteristi
- Page 657 and 658:
homogeneous copolymer, that is, tak
- Page 659 and 660:
process may be used to identify the
- Page 661 and 662:
fractionated sample. They represent
- Page 663 and 664:
Figure 16 An example of poor SEC ch
- Page 665 and 666:
on) methods, whereby the average di
- Page 667 and 668:
23. WH Stockmayer, LD Moore Jr, M F
- Page 669 and 670:
condition, as is explained in this
- Page 671 and 672:
Figure 2 Partition coefficients KL
- Page 673 and 674:
4 COLUMNS FOR HOPC Detailsaregiveni
- Page 675 and 676:
and concomitant clogging of columns
- Page 677 and 678:
Figure 5 Concentration dependence o
- Page 679 and 680:
Table 1 Solution Volume, Polymer Ma
- Page 681 and 682:
in Fig. 4a. The middle fractions (8
- Page 683 and 684:
Figure 10 SEC chromatograms for som
- Page 685 and 686:
appropriate for the early fractions
- Page 687 and 688:
23 Size Exclusion/ Hydrodynamic Chr
- Page 689 and 690:
Figure 2 Calibration curve for the
- Page 691 and 692:
Figure 5 Elutionbehaviorofpolystyre
- Page 693 and 694:
Table 1 Comparison Between SEC and
- Page 695 and 696:
egular SEC column in which the pore
- Page 697:
Such an ideal separation can be obt