Organizational Strategy - Sustainable Development - L'Oréal
Organizational Strategy - Sustainable Development - L'Oréal
Organizational Strategy - Sustainable Development - L'Oréal

You also want an ePaper? Increase the reach of your titles
YUMPU automatically turns print PDFs into web optimized ePapers that Google loves.
5 L’oréaL - GrI DaTa SHEETS 2011<br />
II. STATE OF THE L’ORéAL’S POLICY IN 2011<br />
EC1<br />
2011 GROWTH IN TURNOVeR<br />
on comparable data, i.e. on an identical structure and exchange rates, the growth in the L’oréal group’s turnover was 5.1%.<br />
The net effect of the change in structure was +0.6%.<br />
Monetary effects had a negative impact of 1.4%.<br />
Growth at a constant rate of exchange was 5.7%.<br />
on published data, group turnover, as at 31 December 2011, reached 20.343 billion euros, up by 4.3%.<br />
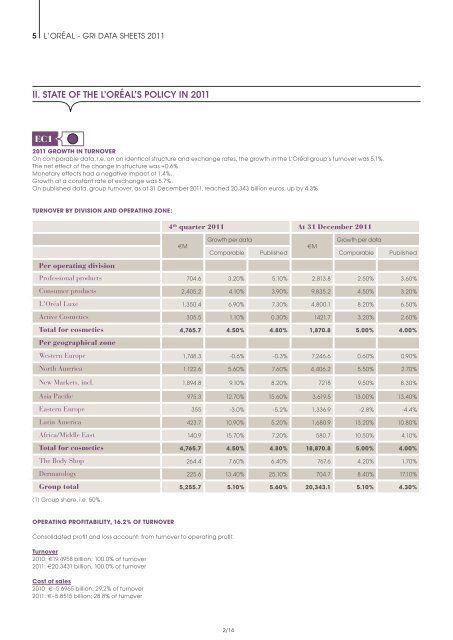
TURNOVeR bY DIVIsION aND OPeRaTING ZONe:<br />
Per operating division<br />
(1) Group share, i.e. 50%.<br />
OPeRaTING PROFITabILITY, 16.2% OF TURNOVeR<br />
Consolidated profit and loss account: from turnover to operating profit.<br />
Turnover<br />
2010: €19.4958 billion; 100.0% of turnover<br />
2011: €20.3431 billion; 100.0% of turnover<br />
Cost of sales<br />
2010: €–5.6965 billion; 29.2% of turnover<br />
2011: €–5.8515 billion; 28.8% of turnover<br />
4 th quarter 2011 At 31 December 2011<br />
eM<br />
Growth per data<br />
Growth per data<br />
eM<br />
Comparable Published Comparable Published<br />
Professional products 704.6 3.20% 5.10% 2,813.8 2.50% 3.60%<br />
Consumer products 2,405.2 4.10% 3.90% 9,835.2 4.50% 3.20%<br />
<strong>L'Oréal</strong> Luxe 1,350.4 6.90% 7.30% 4,800.1 8.20% 6.50%<br />
Active Cosmetics 305.5 1.10% 0.30% 1421.7 3.20% 2.60%<br />
Total for cosmetics 4,765.7 4.50% 4.80% 1,870.8 5.00% 4.00%<br />
Per geographical zone<br />
Western Europe 1,748.3 -0.6% -0.3% 7,246.6 0.60% 0.90%<br />
North America 1,122.6 5.60% 7.60% 4,406.2 5.50% 2.70%<br />
New Markets, incl. 1,894.8 9.10% 8.20% 7218 9.50% 8.30%<br />
Asia Pacific 975.3 12.70% 15.60% 3,619.5 13.00% 13.40%<br />
Eastern Europe 355 -3.0% -5.2% 1,336.9 -2.8% -4.4%<br />
Latin America 423.7 10.90% 5.20% 1,680.9 13.20% 10.80%<br />
Africa/Middle East 140.9 15.70% 7.20% 580.7 10.50% 4.10%<br />
Total for cosmetics 4,765.7 4.50% 4.80% 18,870.8 5.00% 4.00%<br />
The Body Shop 264.4 7.60% 6.40% 767.6 4.20% 1.70%<br />
Dermatology 225.6 13.40% 25.10% 704.7 8.40% 17.10%<br />
Group total 5,255.7 5.10% 5.60% 20,343.1 5.10% 4.30%<br />
2/14