Organizational Strategy - Sustainable Development - L'Oréal
Organizational Strategy - Sustainable Development - L'Oréal
Organizational Strategy - Sustainable Development - L'Oréal

Create successful ePaper yourself
Turn your PDF publications into a flip-book with our unique Google optimized e-Paper software.
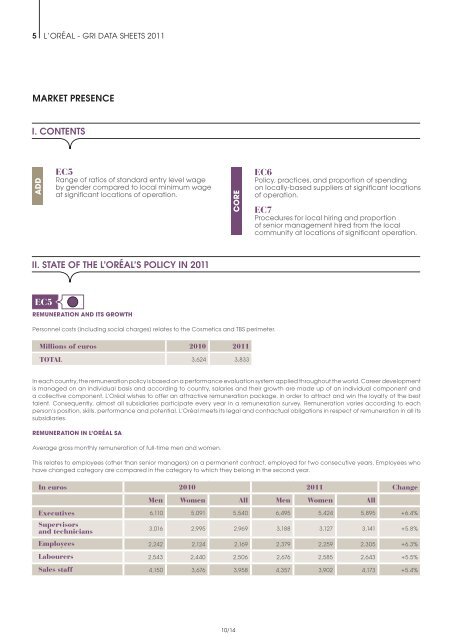
5 L’oréaL - GrI DaTa SHEETS 2011<br />
MARKET PRESENCE<br />
I. CONTENTS<br />
aDD<br />
EC5<br />
range of ratios of standard entry level wage<br />
by gender compared to local minimum wage<br />
at significant locations of operation.<br />
II. STATE OF THE L’ORéAL’S POLICY IN 2011<br />
EC5<br />
ReMUNeRaTION aND ITs GROWTH<br />
Personnel costs (including social charges) relates to the Cosmetics and TBS perimeter.<br />
In each country, the remuneration policy is based on a performance evaluation system applied throughout the world. Career development<br />
is managed on an individual basis and according to country, salaries and their growth are made up of an individual component and<br />
a collective component. L’oréal wishes to offer an attractive remuneration package, in order to attract and win the loyalty of the best<br />
talent. Consequently, almost all subsidiaries participate every year in a remuneration survey. remuneration varies according to each<br />
person’s position, skills, performance and potential. L’oréal meets its legal and contractual obligations in respect of remuneration in all its<br />
subsidiaries.<br />
ReMUNeRaTION IN L’ORÉaL sa<br />
average gross monthly remuneration of full-time men and women.<br />
This relates to employees (other than senior managers) on a permanent contract, employed for two consecutive years. Employees who<br />
have changed category are compared in the category to which they belong in the second year.<br />
CORe<br />
Millions of euros 2010 2011<br />
TOTAL 3,624 3,833<br />
10/14<br />
EC6<br />
Policy, practices, and proportion of spending<br />
on locally-based suppliers at significant locations<br />
of operation.<br />
EC7<br />
Procedures for local hiring and proportion<br />
of senior management hired from the local<br />
community at locations of significant operation.<br />
In euros 2010 2011 Change<br />
Men Women All Men Women All<br />
Executives 6,110 5,091 5,540 6,495 5,424 5,895 +6.4%<br />
Supervisors<br />
and technicians<br />
3,016 2,995 2,969 3,188 3,127 3,141 +5.8%<br />
Employees 2,242 2,124 2,169 2,379 2,259 2,305 +6.3%<br />
Labourers 2,543 2,440 2,506 2,676 2,585 2,643 +5.5%<br />
Sales staff 4,150 3,676 3,958 4,357 3,902 4,173 +5.4%