Organizational Strategy - Sustainable Development - L'Oréal
Organizational Strategy - Sustainable Development - L'Oréal
Organizational Strategy - Sustainable Development - L'Oréal

Create successful ePaper yourself
Turn your PDF publications into a flip-book with our unique Google optimized e-Paper software.
7 L’OréaL - GrI DaTa SHEETS 2011<br />
II. STATE OF THE L’ORÉAL’S POLICY IN 2011<br />
LA1<br />
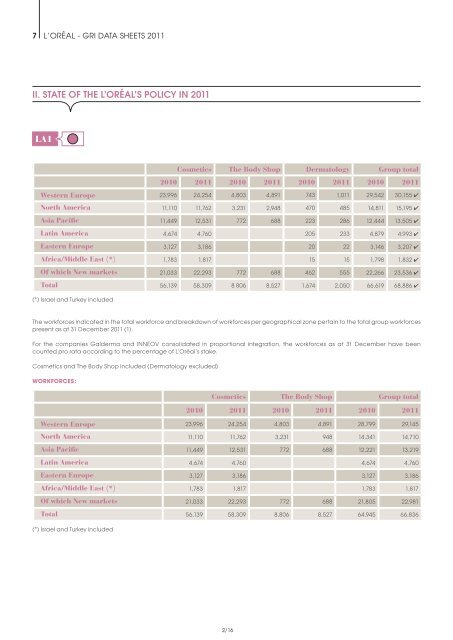
<strong>Development</strong> of group’s reported workforce (proportional companies taken at their rate of consolidation)<br />
Cosmetics The Body Shop Dermatology Group total<br />
(*) Israel and Turkey included<br />
The workforces indicated in the total workforce and breakdown of workforces per geographical zone pertain to the total group workforces<br />
present as at 31 December 2011 (1).<br />
For the companies Galderma and INNEOV consolidated in proportional integration, the workforces as at 31 December have been<br />
counted pro rata according to the percentage of L’Oréal’s stake.<br />
Cosmetics and The Body Shop included (Dermatology excluded)<br />
WORKFORCES:<br />
(*) Israel and Turkey included<br />
2010 2011 2010 2011 2010 2011 2010 2011<br />
Western Europe 23,996 24,254 4,803 4,891 743 1,011 29,542 30,155 4<br />
North America 11,110 11,762 3,231 2,948 470 485 14,811 15,195 4<br />
Asia Pacific 11,449 12,531 772 688 223 286 12,444 13,505 4<br />
Latin America 4,674 4,760 205 233 4,879 4,993 4<br />
Eastern Europe 3,127 3,186 20 22 3,146 3,207 4<br />
Africa/Middle East (*) 1,783 1,817 15 15 1,798 1,832 4<br />
Of which New markets 21,033 22,293 772 688 462 555 22,266 23,536 4<br />
Total 56,139 58,309 8 806 8,527 1,674 2,050 66,619 68,886 4<br />
Cosmetics The Body Shop Group total<br />
2010 2011 2010 2011 2010 2011<br />
Western Europe 23,996 24,254 4,803 4,891 28,799 29,145<br />
North America 11,110 11,762 3,231 948 14,341 14,710<br />
Asia Pacific 11,449 12,531 772 688 12,221 13,219<br />
Latin America 4,674 4,760 4,674 4,760<br />
Eastern Europe 3,127 3,186 3,127 3,186<br />
Africa/Middle East (*) 1,783 1,817 1,783 1,817<br />
Of which New markets 21,033 22,293 772 688 21,805 22,981<br />
Total 56,139 58,309 8,806 8,527 64,945 66,836<br />
2/16