Organizational Strategy - Sustainable Development - L'Oréal
Organizational Strategy - Sustainable Development - L'Oréal
Organizational Strategy - Sustainable Development - L'Oréal

Create successful ePaper yourself
Turn your PDF publications into a flip-book with our unique Google optimized e-Paper software.
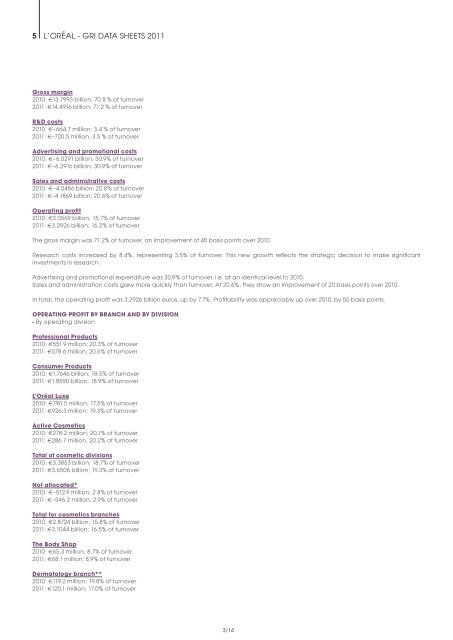
5 L’oréaL - GrI DaTa SHEETS 2011<br />
Gross margin<br />
2010: €13.7993 billion; 70.8 % of turnover<br />
2011: €14.4916 billion; 71.2 % of turnover<br />
R&D costs<br />
2010: €–664.7 million; 3.4 % of turnover<br />
2011: €–720.5 million; 3.5 % of turnover<br />
advertising and promotional costs<br />
2010: €–6.0291 billion; 30.9% of turnover<br />
2011: €–6.2916 billion; 30.9% of turnover<br />
sales and administrative costs<br />
2010: €–4.0486 billion; 20.8% of turnover<br />
2011: €–4.1869 billion; 20.6% of turnover<br />
Operating profit<br />
2010: €3.0569 billion; 15.7% of turnover<br />
2011: €3.2926 billion; 16.2% of turnover<br />
The gross margin was 71.2% of turnover, an improvement of 40 basis points over 2010.<br />
research costs increased by 8.4%, representing 3.5% of turnover. This new growth reflects the strategic decision to make significant<br />
investments in research.<br />
advertising and promotional expenditure was 30.9% of turnover, i.e. at an identical level to 2010.<br />
Sales and administration costs grew more quickly than turnover. at 20.6%, they show an improvement of 20 basis points over 2010.<br />
In total, the operating profit was 3.2926 billion euros, up by 7.7%. Profitability was appreciably up over 2010, by 50 basis points.<br />
OPeRaTING PROFIT bY bRaNCH aND bY DIVIsION<br />
- By operating division<br />
Professional Products<br />
2010: €551.9 million; 20.3% of turnover<br />
2011: €578.6 million; 20.6% of turnover<br />
Consumer Products<br />
2010: €1.7646 billion; 18.5% of turnover<br />
2011: €1.8590 billion; 18.9% of turnover<br />
L’Oréal Luxe<br />
2010: €790.5 million; 17.5% of turnover<br />
2011: €926.3 million; 19.3% of turnover<br />
active Cosmetics<br />
2010: €278.2 million; 20.1% of turnover<br />
2011: €286.7 million; 20.2% of turnover<br />
Total of cosmetic divisions<br />
2010: €3.3853 billion; 18.7% of turnover<br />
2011: €3.6506 billion; 19.3% of turnover<br />
Not allocated*<br />
2010: €–512.9 million; 2.8% of turnover<br />
2011: €–546.2 million; 2.9% of turnover<br />
Total for cosmetics branches<br />
2010: €2.8724 billion; 15.8% of turnover<br />
2011: €3.1044 billion; 16.5% of turnover<br />
The body shop<br />
2010: €65.3 million; 8.7% of turnover<br />
2011: €68.1 million; 8.9% of turnover<br />
Dermatology branch**<br />
2010: €119.2 million; 19.8% of turnover<br />
2011: €120.1 million; 17.0% of turnover<br />
3/14