Organizational Strategy - Sustainable Development - L'Oréal
Organizational Strategy - Sustainable Development - L'Oréal
Organizational Strategy - Sustainable Development - L'Oréal

Create successful ePaper yourself
Turn your PDF publications into a flip-book with our unique Google optimized e-Paper software.
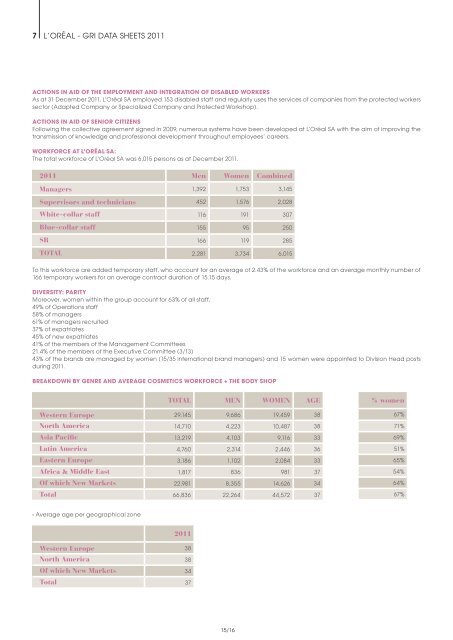
7 L’OréaL - GrI DaTa SHEETS 2011<br />
ACTIONS IN AID OF THE EMPLOYMENT AND INTEGRATION OF DISABLED WORKERS<br />
as at 31 December 2011, L’Oréal Sa employed 153 disabled staff and regularly uses the services of companies from the protected workers<br />
sector (adapted Company or Specialized Company and Protected Workshop).<br />
ACTIONS IN AID OF SENIOR CITIZENS<br />
Following the collective agreement signed in 2009, numerous systems have been developed at L’Oréal Sa with the aim of improving the<br />
transmission of knowledge and professional development throughout employees’ careers.<br />
WORKFORCE AT L’ORÉAL SA:<br />
The total workforce of L’Oréal Sa was 6,015 persons as at December 2011.<br />
2011 Men Women Combined<br />
Managers 1,392 1,753 3,145<br />
Supervisors and technicians 452 1,576 2,028<br />
White-collar staff 116 191 307<br />
Blue-collar staff 155 95 250<br />
SR 166 119 285<br />
TOTAL 2,281 3,734 6,015<br />
To this workforce are added temporary staff, who account for an average of 2.43% of the workforce and an average monthly number of<br />
166 temporary workers for an average contract duration of 15.15 days.<br />
DIVERSITY: PARITY<br />
Moreover, women within the group account for 63% of all staff,<br />
49% of Operations staff<br />
58% of managers<br />
61% of managers recruited<br />
37% of expatriates<br />
45% of new expatriates<br />
41% of the members of the Management Committees<br />
21.4% of the members of the Executive Committee (3/13)<br />
43% of the brands are managed by women (15/35 international brand managers) and 15 women were appointed to Division Head posts<br />
during 2011.<br />
BREAKDOWN BY GENRE AND AVERAGE COSMETICS WORKFORCE + THE BODY SHOP<br />
- average age per geographical zone<br />
TOTAL MEN WOMEN AGE<br />
Western Europe 29,145 9,686 19,459 38<br />
North America 14,710 4,223 10,487 38<br />
Asia Pacific 13,219 4,103 9,116 33<br />
Latin America 4,760 2,314 2,446 36<br />
Eastern Europe 3,186 1,102 2,084 33<br />
Africa & Middle East 1,817 836 981 37<br />
Of which New Markets 22,981 8,355 14,626 34<br />
Total 66,836 22,264 44,572 37<br />
2011<br />
Western Europe 38<br />
North America 38<br />
Of which New Markets 34<br />
Total 37<br />
15/16<br />
% women<br />
67%<br />
71%<br />
69%<br />
51%<br />
65%<br />
54%<br />
64%<br />
67%