Organizational Strategy - Sustainable Development - L'Oréal
Organizational Strategy - Sustainable Development - L'Oréal
Organizational Strategy - Sustainable Development - L'Oréal

Create successful ePaper yourself
Turn your PDF publications into a flip-book with our unique Google optimized e-Paper software.
2 L’OréaL - GrI DaTa SHEETS 2011<br />
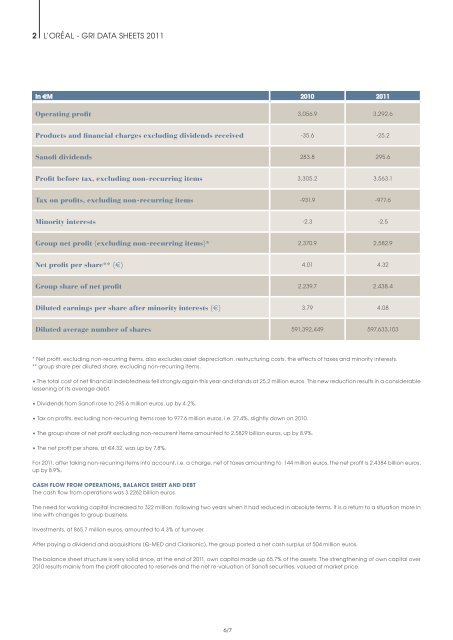
In €M 2010 2011<br />
Operating profit 3,056.9 3,292.6<br />
Products and financial charges excluding dividends received -35.6 -25.2<br />
Sanofi dividends 283.8 295.6<br />
Profit before tax, excluding non-recurring items 3,305.2 3,563.1<br />
Tax on profits, excluding non-recurring items -931.9 -977.6<br />
Minority interests -2.3 -2.5<br />
Group net profit (excluding non-recurring items)* 2,370.9 2,582.9<br />
Net profit per share** (e) 4.01 4.32<br />
Group share of net profit 2,239.7 2,438.4<br />
Diluted earnings per share after minority interests (e) 3.79 4.08<br />
Diluted average number of shares 591,392,449 597,633,103<br />
* Net profit, excluding non-recurring items, also excludes asset depreciation, restructuring costs, the effects of taxes and minority interests.<br />
** group share per diluted share, excluding non-recurring items.<br />
• The total cost of net financial indebtedness fell strongly again this year and stands at 25.2 million euros. This new reduction results in a considerable<br />
lessening of its average debt.<br />
• Dividends from Sanofi rose to 295.6 million euros, up by 4.2%.<br />
• Tax on profits, excluding non-recurring items rose to 977.6 million euros, i.e. 27.4%, slightly down on 2010.<br />
• The group share of net profit excluding non-recurrent items amounted to 2.5829 billion euros, up by 8.9%.<br />
• The net profit per share, at €4.32, was up by 7.8%.<br />
For 2011, after taking non-recurring items into account, i.e. a charge, net of taxes amounting to 144 million euros, the net profit is 2.4384 billion euros,<br />
up by 8.9%.<br />
CASH FLOW FROM OPERATIONS, BALANCE SHEET AND DEBT<br />
The cash flow from operations was 3.2262 billion euros.<br />
The need for working capital increased to 322 million, following two years when it had reduced in absolute terms. It is a return to a situation more in<br />
line with changes to group business.<br />
Investments, at 865.7 million euros, amounted to 4.3% of turnover.<br />
after paying a dividend and acquisitions (Q-MED and Clarisonic), the group posted a net cash surplus of 504 million euros.<br />
The balance sheet structure is very solid since, at the end of 2011, own capital made up 65.7% of the assets. The strengthening of own capital over<br />
2010 results mainly from the profit allocated to reserves and the net re-valuation of Sanofi securities, valued at market price.<br />
6/7