Archaeoseismology and Palaeoseismology in the Alpine ... - Tierra
Archaeoseismology and Palaeoseismology in the Alpine ... - Tierra
Archaeoseismology and Palaeoseismology in the Alpine ... - Tierra

Create successful ePaper yourself
Turn your PDF publications into a flip-book with our unique Google optimized e-Paper software.
The attenuation of <strong>the</strong> recorded seismic data is shown <strong>in</strong><br />
Fig. 3. It is clear that <strong>the</strong> recorded ground motions gives<br />
much higher peak ground acceleration values, than what<br />
is predicted by <strong>the</strong> empirical attenuation relationships.<br />
The largest ground motions were recorded by <strong>the</strong> three<br />
near fault stations Wolong, Q<strong>in</strong>gp<strong>in</strong>g <strong>and</strong> Baijiao, which<br />
recorded maximum values of 957.7, 824.1 <strong>and</strong> 633.1<br />
cm/s 2 , respectively (Li et al., 2008b). The attenuation of<br />
<strong>the</strong> simulated ground motions found <strong>in</strong> <strong>the</strong> present study<br />
is shown as <strong>the</strong> lower graph <strong>in</strong> Fig. 3. From this it can be<br />
seen, that <strong>the</strong> simulated peak acceleration values are<br />
comparable to those recorded dur<strong>in</strong>g <strong>the</strong> earthquake.<br />
Fig.4: Top: Simulated Pseudoacceleration response spectra<br />
for <strong>the</strong> three stations Q<strong>in</strong>gp<strong>in</strong>g, Baijiao <strong>and</strong> Wolong. The<br />
two horizontal components are shown (see legend for<br />
specifications). Bottom: Acceleration response spectra<br />
obta<strong>in</strong>ed from Wolong station <strong>in</strong> Wenchuan dur<strong>in</strong>g <strong>the</strong><br />
ma<strong>in</strong>shock of 12 May 2008, form Li et al., (2008a).<br />
Fig. 4 shows <strong>the</strong> pseudoacceleration response spectra,<br />
from <strong>the</strong> ground motion simulation, for <strong>the</strong> stations <strong>in</strong><br />
Wolong, Q<strong>in</strong>gp<strong>in</strong>g <strong>and</strong> Baijiao (see Fig. 2 for locations).<br />
T<strong>the</strong> predom<strong>in</strong>ant periods of <strong>the</strong> simulated ground<br />
motions are between 0.1s <strong>and</strong> 1s. The simulation results<br />
are well <strong>in</strong> agreement with Li et al. (2008a), which<br />
estimate <strong>the</strong> predom<strong>in</strong>ant spectral acceleration to be<br />
distributed between periods of 0.1s to 0.6s (see <strong>the</strong> lower<br />
graph <strong>in</strong> Fig. 4) <strong>and</strong> <strong>the</strong> ground motion simulation<br />
<strong>the</strong>refore reproduces <strong>the</strong> frequency content of <strong>the</strong><br />
seismic waves to a very large extent.<br />
STRONG GROUND SHAKING AND DAMAGE ON<br />
BUILDINGS<br />
The affected area suffered severe destruction dur<strong>in</strong>g <strong>the</strong><br />
earthquake. The economic losses due to <strong>the</strong> event are<br />
estimated to be 86 billion USD (USGS). The city of<br />
Hanwang is located along <strong>the</strong> fault, approximately 90km<br />
NE of <strong>the</strong> epicentre <strong>and</strong> had 70,000 <strong>in</strong>habitants before<br />
1 st INQUA‐IGCP‐567 International Workshop on Earthquake Archaeology <strong>and</strong> <strong>Palaeoseismology</strong><br />
14<br />
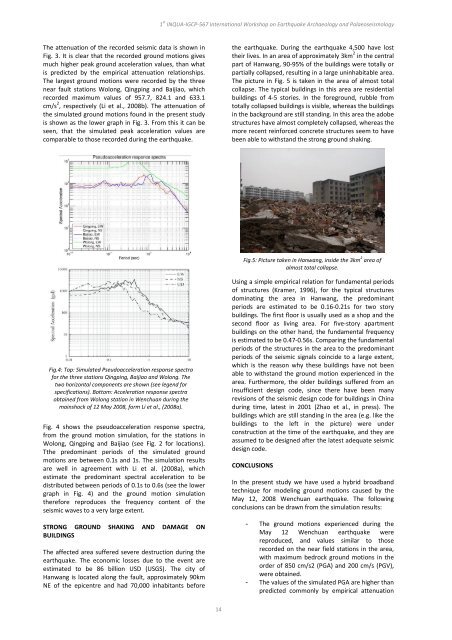
<strong>the</strong> earthquake. Dur<strong>in</strong>g <strong>the</strong> earthquake 4,500 have lost<br />
<strong>the</strong>ir lives. In an area of approximately 3km 2 <strong>in</strong> <strong>the</strong> central<br />
part of Hanwang, 90‐95% of <strong>the</strong> build<strong>in</strong>gs were totally or<br />
partially collapsed, result<strong>in</strong>g <strong>in</strong> a large un<strong>in</strong>habitable area.<br />
The picture <strong>in</strong> Fig. 5 is taken <strong>in</strong> <strong>the</strong> area of almost total<br />
collapse. The typical build<strong>in</strong>gs <strong>in</strong> this area are residential<br />
build<strong>in</strong>gs of 4‐5 stories. In <strong>the</strong> foreground, rubble from<br />
totally collapsed build<strong>in</strong>gs is visible, whereas <strong>the</strong> build<strong>in</strong>gs<br />
<strong>in</strong> <strong>the</strong> background are still st<strong>and</strong><strong>in</strong>g. In this area <strong>the</strong> adobe<br />
structures have almost completely collapsed, whereas <strong>the</strong><br />
more recent re<strong>in</strong>forced concrete structures seem to have<br />
been able to withst<strong>and</strong> <strong>the</strong> strong ground shak<strong>in</strong>g.<br />
Fig.5: Picture taken <strong>in</strong> Hanwang, <strong>in</strong>side <strong>the</strong> 3km 2 area of<br />
almost total collapse.<br />
Us<strong>in</strong>g a simple empirical relation for fundamental periods<br />
of structures (Kramer, 1996), for <strong>the</strong> typical structures<br />
dom<strong>in</strong>at<strong>in</strong>g <strong>the</strong> area <strong>in</strong> Hanwang, <strong>the</strong> predom<strong>in</strong>ant<br />
periods are estimated to be 0.16‐0.21s for two story<br />
build<strong>in</strong>gs. The first floor is usually used as a shop <strong>and</strong> <strong>the</strong><br />
second floor as liv<strong>in</strong>g area. For five‐story apartment<br />
build<strong>in</strong>gs on <strong>the</strong> o<strong>the</strong>r h<strong>and</strong>, <strong>the</strong> fundamental frequency<br />
is estimated to be 0.47‐0.56s. Compar<strong>in</strong>g <strong>the</strong> fundamental<br />
periods of <strong>the</strong> structures <strong>in</strong> <strong>the</strong> area to <strong>the</strong> predom<strong>in</strong>ant<br />
periods of <strong>the</strong> seismic signals co<strong>in</strong>cide to a large extent,<br />
which is <strong>the</strong> reason why <strong>the</strong>se build<strong>in</strong>gs have not been<br />
able to withst<strong>and</strong> <strong>the</strong> ground motion experienced <strong>in</strong> <strong>the</strong><br />
area. Fur<strong>the</strong>rmore, <strong>the</strong> older build<strong>in</strong>gs suffered from an<br />
<strong>in</strong>sufficient design code, s<strong>in</strong>ce <strong>the</strong>re have been many<br />
revisions of <strong>the</strong> seismic design code for build<strong>in</strong>gs <strong>in</strong> Ch<strong>in</strong>a<br />
dur<strong>in</strong>g time, latest <strong>in</strong> 2001 (Zhao et al., <strong>in</strong> press). The<br />
build<strong>in</strong>gs which are still st<strong>and</strong><strong>in</strong>g <strong>in</strong> <strong>the</strong> area (e.g. like <strong>the</strong><br />
build<strong>in</strong>gs to <strong>the</strong> left <strong>in</strong> <strong>the</strong> picture) were under<br />
construction at <strong>the</strong> time of <strong>the</strong> earthquake, <strong>and</strong> <strong>the</strong>y are<br />
assumed to be designed after <strong>the</strong> latest adequate seismic<br />
design code.<br />
CONCLUSIONS<br />
In <strong>the</strong> present study we have used a hybrid broadb<strong>and</strong><br />
technique for model<strong>in</strong>g ground motions caused by <strong>the</strong><br />
May 12, 2008 Wenchuan earthquake. The follow<strong>in</strong>g<br />
conclusions can be drawn from <strong>the</strong> simulation results:<br />
- The ground motions experienced dur<strong>in</strong>g <strong>the</strong><br />
May 12 Wenchuan earthquake were<br />
reproduced, <strong>and</strong> values similar to those<br />
recorded on <strong>the</strong> near field stations <strong>in</strong> <strong>the</strong> area,<br />
with maximum bedrock ground motions <strong>in</strong> <strong>the</strong><br />
order of 850 cm/s2 (PGA) <strong>and</strong> 200 cm/s (PGV),<br />
were obta<strong>in</strong>ed.<br />
- The values of <strong>the</strong> simulated PGA are higher than<br />
predicted commonly by empirical attenuation