Progress Report 2007-2008 - Department of Environment and ...
Progress Report 2007-2008 - Department of Environment and ...
Progress Report 2007-2008 - Department of Environment and ...

Create successful ePaper yourself
Turn your PDF publications into a flip-book with our unique Google optimized e-Paper software.
Employment<br />
MIG indicator 6.5.a: Direct <strong>and</strong> indirect employment in the forest sector <strong>and</strong> forest sector employment as a proportion/percentage <strong>of</strong><br />
total employment (UNE, LNE, Eden, Southern regions)<br />
Indicator 6.4: Employment numbers by type across all forest users in the Eden region<br />
Employment in the forest sector, including by Forests NSW <strong>and</strong> by DECC, decreased when<br />
compared with 2006–<strong>2007</strong> figures.<br />
Employment in the forest management <strong>and</strong> conservation sector is important to many regional<br />
economies. Data within this indicator have been provided by Forests NSW (direct <strong>and</strong> indirect<br />
employment) <strong>and</strong> PWG (direct employees only).<br />
In <strong>2007</strong>–<strong>2008</strong>, the estimate for total employment in forest sector decreased slightly (figure 2-6B).<br />
At the end <strong>of</strong> <strong>2007</strong>–<strong>2008</strong>, employment by Forests NSW was estimated to be 511 <strong>and</strong> PWG 736, (or<br />
1247 equivalent full-time (EFT) employees combined for Forests NSW <strong>and</strong> PWG).<br />
Forests NSW – direct <strong>and</strong> indirect employment<br />
The direct <strong>and</strong> indirect employment figures provided by Forests NSW cover a range <strong>of</strong> activities,<br />
including growing <strong>and</strong> managing <strong>of</strong> forests, harvesting <strong>and</strong> haulage, primary processing, apiary,<br />
grazing <strong>and</strong> other activities (such as gravel extraction <strong>and</strong> plantation establishment contractors).<br />
Estimated total direct <strong>and</strong> indirect employment in the forest sector, by Forests NSW, totalled<br />
5493 EFT positions across all regions for <strong>2007</strong>–<strong>2008</strong> (Table 2-6A). Similarly with last year, the<br />
largest employment sector was primary processing, which made up 65% <strong>of</strong> its total employment across<br />
all forest agreement regions (figures 2-6B <strong>and</strong> 2-6C). Harvesting <strong>and</strong> haulage accounted for 14% <strong>of</strong><br />
employment, growing <strong>and</strong> managing forests accounted for 9%, <strong>and</strong> apiary 4%.<br />
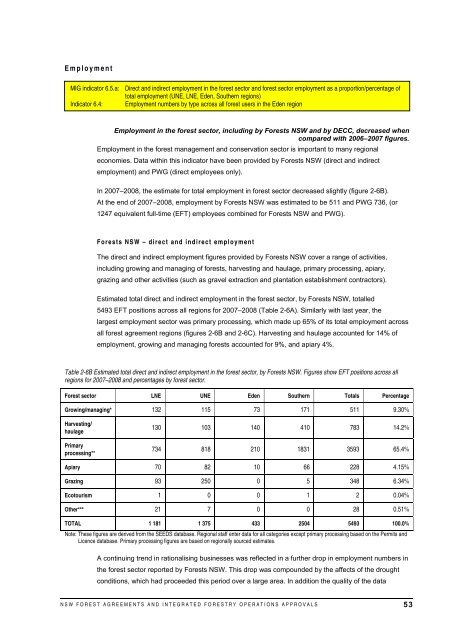
Table 2-6B Estimated total direct <strong>and</strong> indirect employment in the forest sector, by Forests NSW. Figures show EFT positions across all<br />
regions for <strong>2007</strong>–<strong>2008</strong> <strong>and</strong> percentages by forest sector.<br />
Forest sector LNE UNE Eden Southern Totals Percentage<br />
Growing/managing* 132 115 73 171 511 9.30%<br />
Harvesting/<br />
haulage<br />
Primary<br />
processing**<br />
130 103 140 410 783 14.2%<br />
734 818 210 1831 3593 65.4%<br />
Apiary 70 82 10 66 228 4.15%<br />
Grazing 93 250 0 5 348 6.34%<br />
Ecotourism 1 0 0 1 2 0.04%<br />
Other*** 21 7 0 0 28 0.51%<br />
TOTAL 1 181 1 375 433 2504 5493 100.0%<br />
Note: These figures are derived from the SEEDS database. Regional staff enter data for all categories except primary processing based on the Permits <strong>and</strong><br />
Licence database. Primary processing figures are based on regionally sourced estimates.<br />
A continuing trend in rationalising businesses was reflected in a further drop in employment numbers in<br />
the forest sector reported by Forests NSW. This drop was compounded by the affects <strong>of</strong> the drought<br />
conditions, which had proceeded this period over a large area. In addition the quality <strong>of</strong> the data<br />
NSW FOREST AGREEMENTS AND INTEGRATED FORESTRY OPERATIONS APPROVALS 53