The way ahead? - Vodafone
The way ahead? - Vodafone
The way ahead? - Vodafone

You also want an ePaper? Increase the reach of your titles
YUMPU automatically turns print PDFs into web optimized ePapers that Google loves.
Overview<br />
Business<br />
review Performance Governance Financials<br />
Additional<br />
information<br />
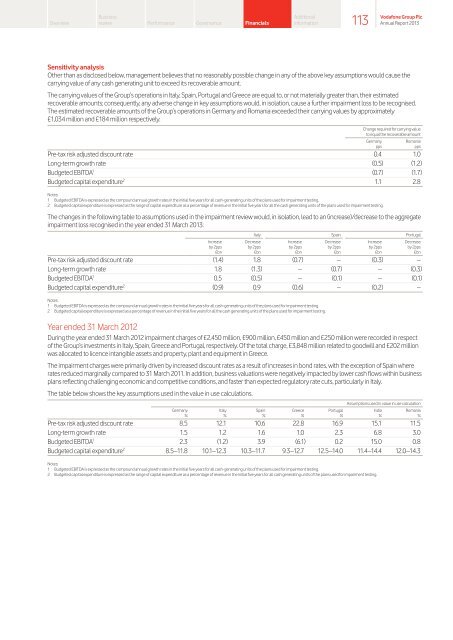
Sensitivity analysis<br />
Other than as disclosed below, management believes that no reasonably possible change in any of the above key assumptions would cause the<br />
carrying value of any cash generating unit to exceed its recoverable amount.<br />
<strong>The</strong> carrying values of the Group’s operations in Italy, Spain, Portugal and Greece are equal to, or not materially greater than, their estimated<br />
recoverable amounts; consequently, any adverse change in key assumptions would, in isolation, cause a further impairment loss to be recognised.<br />
<strong>The</strong> estimated recoverable amounts of the Group’s operations in Germany and Romania exceeded their carrying values by approximately<br />
£1,034 million and £184 million respectively.<br />
Change required for carrying value<br />
to equal the recoverable amount<br />
Germany Romania<br />
pps pps<br />
Pre‑tax risk adjusted discount rate 0.4 1.0<br />
Long-term growth rate (0.5) (1.2)<br />
Budgeted EBITDA 1 (0.7) (1.7)<br />
Budgeted capital expenditure 2 1.1 2.8<br />
Notes:<br />
1 Budgeted EBITDA is expressed as the compound annual growth rates in the initial five years for all cash‑generating units of the plans used for impairment testing.<br />
2 Budgeted capital expenditure is expressed as the range of capital expenditure as a percentage of revenue in the initial five years for all the cash generating units of the plans used for impairment testing.<br />
<strong>The</strong> changes in the following table to assumptions used in the impairment review would, in isolation, lead to an (increase)/decrease to the aggregate<br />
impairment loss recognised in the year ended 31 March 2013:<br />
Italy Spain Portugal<br />
Increase Decrease Increase Decrease Increase Decrease<br />
by 2pps by 2pps by 2pps by 2pps by 2pps by 2pps<br />
£bn £bn £bn £bn £bn £bn<br />
Pre‑tax risk adjusted discount rate (1.4) 1.8 (0.7) – (0.3) –<br />
Long-term growth rate 1.8 (1.3) – (0.7) – (0.3)<br />
Budgeted EBITDA 1 0.5 (0.5) – (0.1) – (0.1)<br />
Budgeted capital expenditure 2 (0.9) 0.9 (0.6) – (0.2) –<br />
Notes:<br />
1 Budgeted EBITDA is expressed as the compound annual growth rates in the initial five years for all cash‑generating units of the plans used for impairment testing.<br />
2 Budgeted capital expenditure is expressed as a percentage of revenue in the initial five years for all the cash generating units of the plans used for impairment testing.<br />
Year ended 31 March 2012<br />
During the year ended 31 March 2012 impairment charges of £2,450 million, £900 million, £450 million and £250 million were recorded in respect<br />
of the Group’s investments in Italy, Spain, Greece and Portugal, respectively. Of the total charge, £3,848 million related to goodwill and £202 million<br />
was allocated to licence intangible assets and property, plant and equipment in Greece.<br />
<strong>The</strong> impairment charges were primarily driven by increased discount rates as a result of increases in bond rates, with the exception of Spain where<br />
rates reduced marginally compared to 31 March 2011. In addition, business valuations were negatively impacted by lower cash flows within business<br />
plans reflecting challenging economic and competitive conditions, and faster than expected regulatory rate cuts, particularly in Italy.<br />
<strong>The</strong> table below shows the key assumptions used in the value in use calculations.<br />
Assumptions used in value in use calculation<br />
Germany Italy Spain Greece Portugal India Romania<br />
% % % % % % %<br />
Pre‑tax risk adjusted discount rate 8.5 12.1 10.6 22.8 16.9 15.1 11.5<br />
Long-term growth rate 1.5 1.2 1.6 1.0 2.3 6.8 3.0<br />
Budgeted EBITDA 1 2.3 (1.2) 3.9 (6.1) 0.2 15.0 0.8<br />
Budgeted capital expenditure 2 8.5–11.8 10.1–12.3 10.3–11.7 9.3–12.7 12.5–14.0 11.4–14.4 12.0–14.3<br />
113<br />
Notes:<br />
1 Budgeted EBITDA is expressed as the compound annual growth rates in the initial five years for all cash‑generating units of the plans used for impairment testing.<br />
2 Budgeted capital expenditure is expressed as the range of capital expenditure as a percentage of revenue in the initial five years for all cash generating units of the plans used for impairment testing.<br />
<strong>Vodafone</strong> Group Plc<br />
Annual Report 2013