The way ahead? - Vodafone
The way ahead? - Vodafone
The way ahead? - Vodafone

You also want an ePaper? Increase the reach of your titles
YUMPU automatically turns print PDFs into web optimized ePapers that Google loves.
Overview<br />
Business<br />
review Performance Governance Financials<br />
Africa, Middle East and Asia Pacific<br />
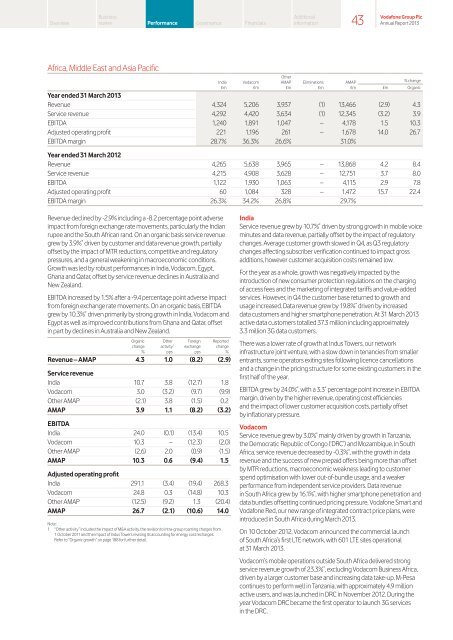
Revenue declined by -2.9% including a -8.2 percentage point adverse<br />
impact from foreign exchange rate movements, particularly the Indian<br />
rupee and the South African rand. On an organic basis service revenue<br />
grew by 3.9% * driven by customer and data revenue growth, partially<br />
offset by the impact of MTR reductions, competitive and regulatory<br />
pressures, and a general weakening in macroeconomic conditions.<br />
Growth was led by robust performances in India, Vodacom, Egypt,<br />
Ghana and Qatar, offset by service revenue declines in Australia and<br />
New Zealand.<br />
EBITDA increased by 1.5% after a -9.4 percentage point adverse impact<br />
from foreign exchange rate movements. On an organic basis, EBITDA<br />
grew by 10.3% * driven primarily by strong growth in India, Vodacom and<br />
Egypt as well as improved contributions from Ghana and Qatar, offset<br />
in part by declines in Australia and New Zealand.<br />
Organic<br />
change<br />
%<br />
Other<br />
activity 1<br />
pps<br />
Foreign<br />
exchange<br />
pps<br />
Reported<br />
change<br />
%<br />
Revenue – AMAP 4.3 1.0 (8.2) (2.9)<br />
Service revenue<br />
India 10.7 3.8 (12.7) 1.8<br />
Vodacom 3.0 (3.2) (9.7) (9.9)<br />
Other AMAP (2.1) 3.8 (1.5) 0.2<br />
AMAP 3.9 1.1 (8.2) (3.2)<br />
EBITDA<br />
India 24.0 (0.1) (13.4) 10.5<br />
Vodacom 10.3 – (12.3) (2.0)<br />
Other AMAP (2.6) 2.0 (0.9) (1.5)<br />
AMAP 10.3 0.6 (9.4) 1.5<br />
Adjusted operating profit<br />
India 291.1 (3.4) (19.4) 268.3<br />
Vodacom 24.8 0.3 (14.8) 10.3<br />
Other AMAP (12.5) (9.2) 1.3 (20.4)<br />
AMAP 26.7 (2.1) (10.6) 14.0<br />
Note:<br />
1 “Other activity” includes the impact of M&A activity, the revision to intra-group roaming charges from<br />
1 October 2011 and the impact of Indus Towers revising its accounting for energy cost recharges.<br />
Refer to “Organic growth” on page 188 for further detail.<br />
India<br />
£m<br />
Vodacom<br />
£m<br />
Other<br />
AMAP<br />
£m<br />
Additional<br />
information<br />
Eliminations<br />
£m<br />
AMAP<br />
£m<br />
% change<br />
£m Organic<br />
Year ended 31 March 2013<br />
Revenue 4,324 5,206 3,937 (1) 13,466 (2.9) 4.3<br />
Service revenue 4,292 4,420 3,634 (1) 12,345 (3.2) 3.9<br />
EBITDA 1,240 1,891 1,047 – 4,178 1.5 10.3<br />
Adjusted operating profit 221 1,196 261 – 1,678 14.0 26.7<br />
EBITDA margin 28.7% 36.3% 26.6% 31.0%<br />
Year ended 31 March 2012<br />
Revenue 4,265 5,638 3,965 – 13,868 4.2 8.4<br />
Service revenue 4,215 4,908 3,628 – 12,751 3.7 8.0<br />
EBITDA 1,122 1,930 1,063 – 4,115 2.9 7.8<br />
Adjusted operating profit 60 1,084 328 – 1,472 15.7 22.4<br />
EBITDA margin 26.3% 34.2% 26.8% 29.7%<br />
43<br />
<strong>Vodafone</strong> Group Plc<br />
Annual Report 2013<br />
India<br />
Service revenue grew by 10.7% * driven by strong growth in mobile voice<br />
minutes and data revenue, partially offset by the impact of regulatory<br />
changes. Average customer growth slowed in Q4, as Q3 regulatory<br />
changes affecting subscriber verification continued to impact gross<br />
additions, however customer acquisition costs remained low.<br />
For the year as a whole, growth was negatively impacted by the<br />
introduction of new consumer protection regulations on the charging<br />
of access fees and the marketing of integrated tariffs and value-added<br />
services. However, in Q4 the customer base returned to growth and<br />
usage increased. Data revenue grew by 19.8% * driven by increased<br />
data customers and higher smartphone penetration. At 31 March 2013<br />
active data customers totalled 37.3 million including approximately<br />
3.3 million 3G data customers.<br />
<strong>The</strong>re was a lower rate of growth at Indus Towers, our network<br />
infrastructure joint venture, with a slow down in tenancies from smaller<br />
entrants, some operators exiting sites following licence cancellations<br />
and a change in the pricing structure for some existing customers in the<br />
first half of the year.<br />
EBITDA grew by 24.0% * , with a 3.3 * percentage point increase in EBITDA<br />
margin, driven by the higher revenue, operating cost efficiencies<br />
and the impact of lower customer acquisition costs, partially offset<br />
by inflationary pressure.<br />
Vodacom<br />
Service revenue grew by 3.0% * mainly driven by growth in Tanzania,<br />
the Democratic Republic of Congo (‘DRC’) and Mozambique. In South<br />
Africa, service revenue decreased by -0.3% * , with the growth in data<br />
revenue and the success of new prepaid offers being more than offset<br />
by MTR reductions, macroeconomic weakness leading to customer<br />
spend optimisation with lower out-of-bundle usage, and a weaker<br />
performance from independent service providers. Data revenue<br />
in South Africa grew by 16.1% * , with higher smartphone penetration and<br />
data bundles offsetting continued pricing pressure. <strong>Vodafone</strong> Smart and<br />
<strong>Vodafone</strong> Red, our new range of integrated contract price plans, were<br />
introduced in South Africa during March 2013.<br />
On 10 October 2012, Vodacom announced the commercial launch<br />
of South Africa’s first LTE network, with 601 LTE sites operational<br />
at 31 March 2013.<br />
Vodacom’s mobile operations outside South Africa delivered strong<br />
service revenue growth of 23.3% * , excluding Vodacom Business Africa,<br />
driven by a larger customer base and increasing data take-up. M-Pesa<br />
continues to perform well in Tanzania, with approximately 4.9 million<br />
active users, and was launched in DRC in November 2012. During the<br />
year Vodacom DRC became the first operator to launch 3G services<br />
in the DRC.