The way ahead? - Vodafone
The way ahead? - Vodafone
The way ahead? - Vodafone

You also want an ePaper? Increase the reach of your titles
YUMPU automatically turns print PDFs into web optimized ePapers that Google loves.
Overview<br />
Business<br />
review Performance Governance Financials<br />
Relative spend on pay<br />
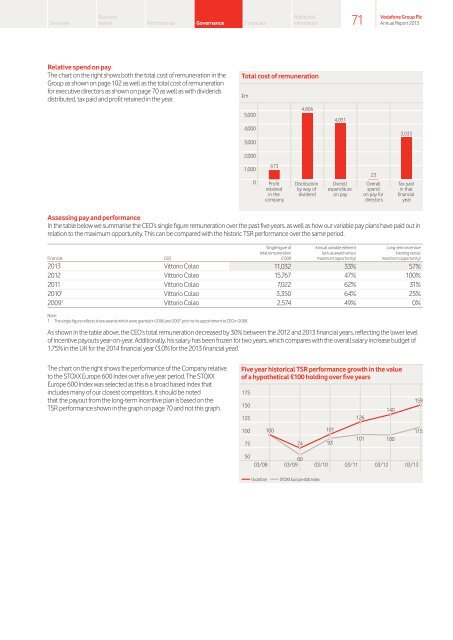
<strong>The</strong> chart on the right shows both the total cost of remuneration in the<br />
Group as shown on page 102 as well as the total cost of remuneration<br />
for executive directors as shown on page 70 as well as with dividends<br />
distributed, tax paid and profit retained in the year.<br />
Total cost of remuneration<br />
£m<br />
5,000<br />
4,000<br />
3,000<br />
2,000<br />
1,000<br />
673<br />
0 Profit<br />
retained<br />
in the<br />
company<br />
4,806<br />
Distribution<br />
by <strong>way</strong> of<br />
dividend<br />
4,051<br />
Overall<br />
expenditure<br />
on pay<br />
23<br />
Overall<br />
spend<br />
on pay for<br />
directors<br />
3,033<br />
Tax paid<br />
in that<br />
financial<br />
year<br />
Assessing pay and performance<br />
In the table below we summarise the CEO’s single figure remuneration over the past five years, as well as how our variable pay plans have paid out in<br />
relation to the maximum opportunity. This can be compared with the historic TSR performance over the same period.<br />
Financial CEO<br />
Single figure of<br />
total remuneration<br />
£’000<br />
Annual variable element<br />
(actual award versus<br />
maximum opportunity)<br />
Long-term incentive<br />
(vesting versus<br />
maximum opportunity)<br />
2013 Vittorio Colao 11,032 33% 57%<br />
2012 Vittorio Colao 15,767 47% 100%<br />
2011 Vittorio Colao 7,022 62% 31%<br />
2010 1 Vittorio Colao 3,350 64% 25%<br />
2009 1 Vittorio Colao 2,574 49% 0%<br />
Note:<br />
1 <strong>The</strong> single figure reflects share awards which were granted in 2006 and 2007, prior to his appointment to CEO in 2008.<br />
As shown in the table above, the CEO’s total remuneration decreased by 30% between the 2012 and 2013 financial years, reflecting the lower level<br />
of incentive payouts year-on-year. Additionally, his salary has been frozen for two years, which compares with the overall salary increase budget of<br />
1.75% in the UK for the 2014 financial year (3.0% for the 2013 financial year).<br />
<strong>The</strong> chart on the right shows the performance of the Company relative<br />
to the STOXX Europe 600 Index over a five year period. <strong>The</strong> STOXX<br />
Europe 600 Index was selected as this is a broad based index that<br />
includes many of our closest competitors. It should be noted<br />
that the payout from the long-term incentive plan is based on the<br />
TSR performance shown in the graph on page 70 and not this graph.<br />
Five year historical TSR performance growth in the value<br />
of a hypothetical €100 holding over five years<br />
175<br />
150<br />
125<br />
100<br />
75<br />
50<br />
100<br />
Additional<br />
information<br />
74<br />
03/08<br />
60<br />
03/09 03/10 03/11 03/12 03/13<br />
<strong>Vodafone</strong> STOXX Europe 600 Index<br />
101<br />
93<br />
71<br />
126<br />
101<br />
<strong>Vodafone</strong> Group Plc<br />
Annual Report 2013<br />
140<br />
100<br />
159<br />
115