The way ahead? - Vodafone
The way ahead? - Vodafone
The way ahead? - Vodafone

Create successful ePaper yourself
Turn your PDF publications into a flip-book with our unique Google optimized e-Paper software.
114<br />
<strong>Vodafone</strong> Group Plc<br />
Annual Report 2013<br />
Notes to the consolidated financial statements (continued)<br />
12. Impairment review (continued)<br />
Sensitivity analysis<br />
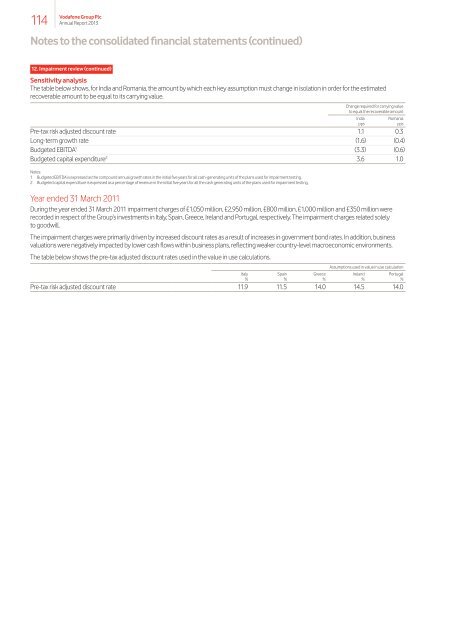
<strong>The</strong> table below shows, for India and Romania, the amount by which each key assumption must change in isolation in order for the estimated<br />
recoverable amount to be equal to its carrying value.<br />
Change required for carrying value<br />
to equal the recoverable amount<br />
India Romania<br />
pps pps<br />
Pre‑tax risk adjusted discount rate 1.1 0.3<br />
Long-term growth rate (1.6) (0.4)<br />
Budgeted EBITDA 1 (3.3) (0.6)<br />
Budgeted capital expenditure 2 3.6 1.0<br />
Notes:<br />
1 Budgeted EBITDA is expressed as the compound annual growth rates in the initial five years for all cash‑generating units of the plans used for impairment testing.<br />
2 Budgeted capital expenditure is expressed as a percentage of revenue in the initial five years for all the cash generating units of the plans used for impairment testing.<br />
Year ended 31 March 2011<br />
During the year ended 31 March 2011 impairment charges of £1,050 million, £2,950 million, £800 million, £1,000 million and £350 million were<br />
recorded in respect of the Group’s investments in Italy, Spain, Greece, Ireland and Portugal, respectively. <strong>The</strong> impairment charges related solely<br />
to goodwill.<br />
<strong>The</strong> impairment charges were primarily driven by increased discount rates as a result of increases in government bond rates. In addition, business<br />
valuations were negatively impacted by lower cash flows within business plans, reflecting weaker country‑level macroeconomic environments.<br />
<strong>The</strong> table below shows the pre‑tax adjusted discount rates used in the value in use calculations.<br />
Assumptions used in value in use calculation<br />
Italy Spain Greece Ireland Portugal<br />
% % % % %<br />
Pre‑tax risk adjusted discount rate 11.9 11.5 14.0 14.5 14.0