The way ahead? - Vodafone
The way ahead? - Vodafone
The way ahead? - Vodafone

Create successful ePaper yourself
Turn your PDF publications into a flip-book with our unique Google optimized e-Paper software.
Overview<br />
Business<br />
review Performance Governance Financials<br />
Additional<br />
information<br />
Organic<br />
change<br />
%<br />
Other<br />
activity 1<br />
pps<br />
Foreign<br />
exchange<br />
pps<br />
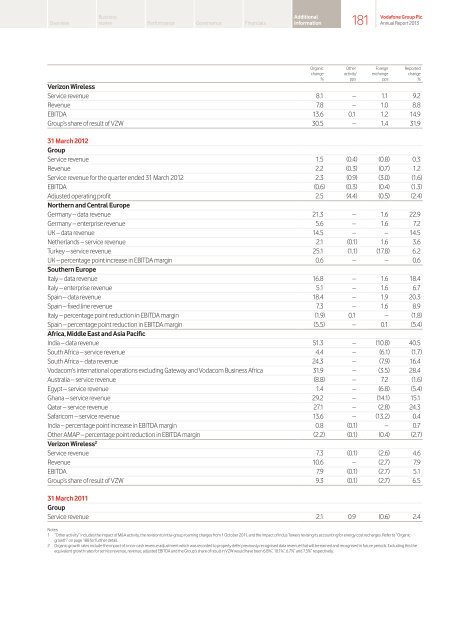
Verizon Wireless<br />
Service revenue 8.1 – 1.1 9.2<br />
Revenue 7.8 – 1.0 8.8<br />
EBITDA 13.6 0.1 1.2 14.9<br />
Group’s share of result of VZW 30.5 – 1.4 31.9<br />
31 March 2012<br />
Group<br />
Service revenue 1.5 (0.4) (0.8) 0.3<br />
Revenue 2.2 (0.3) (0.7) 1.2<br />
Service revenue for the quarter ended 31 March 2012 2.3 (0.9) (3.0) (1.6)<br />
EBITDA (0.6) (0.3) (0.4) (1.3)<br />
Adjusted operating profit 2.5 (4.4) (0.5) (2.4)<br />
Northern and Central Europe<br />
Germany – data revenue 21.3 – 1.6 22.9<br />
Germany – enterprise revenue 5.6 – 1.6 7.2<br />
UK – data revenue 14.5 – – 14.5<br />
Netherlands – service revenue 2.1 (0.1) 1.6 3.6<br />
Turkey – service revenue 25.1 (1.1) (17.8) 6.2<br />
UK – percentage point increase in EBITDA margin 0.6 – – 0.6<br />
Southern Europe<br />
Italy – data revenue 16.8 – 1.6 18.4<br />
Italy – enterprise revenue 5.1 – 1.6 6.7<br />
Spain – data revenue 18.4 – 1.9 20.3<br />
Spain – fixed line revenue 7.3 – 1.6 8.9<br />
Italy – percentage point reduction in EBITDA margin (1.9) 0.1 – (1.8)<br />
Spain – percentage point reduction in EBITDA margin (5.5) – 0.1 (5.4)<br />
Africa, Middle East and Asia Pacific<br />
India – data revenue 51.3 – (10.8) 40.5<br />
South Africa – service revenue 4.4 – (6.1) (1.7)<br />
South Africa – data revenue 24.3 – (7.9) 16.4<br />
Vodacom’s international operations excluding Gate<strong>way</strong> and Vodacom Business Africa 31.9 – (3.5) 28.4<br />
Australia – service revenue (8.8) – 7.2 (1.6)<br />
Egypt – service revenue 1.4 – (6.8) (5.4)<br />
Ghana – service revenue 29.2 – (14.1) 15.1<br />
Qatar – service revenue 27.1 – (2.8) 24.3<br />
Safaricom – service revenue 13.6 – (13.2) 0.4<br />
India – percentage point increase in EBITDA margin 0.8 (0.1) – 0.7<br />
Other AMAP – percentage point reduction in EBITDA margin (2.2) (0.1) (0.4) (2.7)<br />
Verizon Wireless 2<br />
Service revenue 7.3 (0.1) (2.6) 4.6<br />
Revenue 10.6 – (2.7) 7.9<br />
EBITDA 7.9 (0.1) (2.7) 5.1<br />
Group’s share of result of VZW 9.3 (0.1) (2.7) 6.5<br />
181<br />
<strong>Vodafone</strong> Group Plc<br />
Annual Report 2013<br />
31 March 2011<br />
Group<br />
Service revenue 2.1 0.9 (0.6) 2.4<br />
Notes:<br />
1 “Other activity” includes the impact of M&A activity, the revision to intra-group roaming charges from 1 October 2011, and the impact of Indus Towers revising its accounting for energy cost recharges. Refer to “Organic<br />
growth” on page 188 for further detail.<br />
2 Organic growth rates include the impact of a non-cash revenue adjustment which was recorded to properly defer previously recognised data revenue that will be earned and recognised in future periods. Excluding this the<br />
equivalent growth rates for service revenue, revenue, adjusted EBITDA and the Group’s share of result in VZW would have been 6.8% * , 10.1% * , 6.7% * and 7.5% * respectively.<br />
Reported<br />
change<br />
%