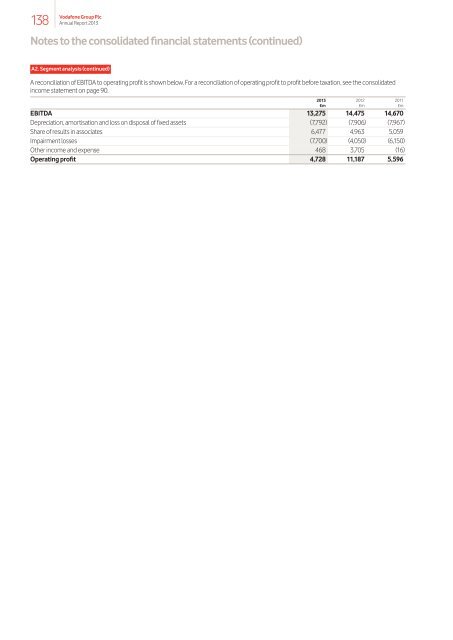
138 <strong>Vodafone</strong> Group Plc Annual Report 2013 Notes to the consolidated financial statements (continued) A2. Segment analysis (continued) A reconciliation of EBITDA to operating profit is shown below. For a reconciliation of operating profit to profit before taxation, see the consolidated income statement on page 90. 2013 2012 2011 £m £m £m EBITDA 13,275 14,475 14,670 Depreciation, amortisation and loss on disposal of fixed assets (7,792) (7,906) (7,967) Share of results in associates 6,477 4,963 5,059 Impairment losses (7,700) (4,050) (6,150) Other income and expense 468 3,705 (16) Operating profit 4,728 11,187 5,596
Overview Business review Performance Governance Financials Other expenditure Depreciation Non-current Capital on intangible and Impairment assets 1 expenditure 2 assets amortisation loss £m £m £m £m £m 31 March 2013 Germany 19,109 1,073 2 1,423 – UK 7,063 601 863 888 – Other Northern and Central Europe 10,211 1,015 1,335 1,268 – Northern and Central Europe 36,383 2,689 2,200 3,579 – Italy 9,369 567 10 744 4,500 Spain 4,599 377 – 590 3,200 Other Southern Europe 2,668 225 – 328 – Southern Europe 16,636 1,169 10 1,662 7,700 India 7,946 554 130 1,021 – Vodacom 5,668 703 10 696 – Other Africa, Middle East and Asia Pacific 5,242 720 90 819 – Africa, Middle East and Asia Pacific 18,856 1,977 230 2,536 – Non-Controlled Interests and Common Functions 853 431 – (77) – Group 72,728 6,266 2,440 7,700 7,700 31 March 2012 Germany 19,151 880 4 1,469 – UK 6,430 575 – 880 – Other Northern and Central Europe 7,418 830 52 1,026 – Northern and Central Europe 32,999 2,285 56 3,375 – Italy 13,978 621 875 783 2,450 Spain 8,069 429 71 626 900 Other Southern Europe 2,723 260 261 361 700 Southern Europe 24,770 1,310 1,207 1,770 4,050 India 8,431 805 – 1,066 – Vodacom 6,469 723 – 840 – Other Africa, Middle East and Asia Pacific 4,735 793 – 771 – Africa, Middle East and Asia Pacific 19,635 2,321 – 2,677 – Non-Controlled Interests and Common Functions 765 449 – 37 – Group 78,169 6,365 1,263 7,859 4,050 31 March 2011 Germany 20,764 824 1,214 1,361 – UK 6,665 516 – 874 – Other Northern and Central Europe 8,037 940 32 1,007 1,000 Northern and Central Europe 35,466 2,280 1,246 3,242 1,000 Italy 16,645 590 12 732 1,050 Spain 9,596 517 – 641 2,950 Other Southern Europe 3,401 290 27 399 1,150 Southern Europe 29,642 1,397 39 1,772 5,150 India 9,882 870 1,851 973 – Vodacom 7,382 572 19 1,013 – Other Africa, Middle East and Asia Pacific 4,797 754 2 793 – Africa, Middle East and Asia Pacific 22,061 2,196 1,872 2,779 – Non-Controlled Interests and Common Functions 1,570 346 9 83 – Group 88,739 6,219 3,166 7,876 6,150 Notes: 1 Comprises goodwill, other intangible assets and property, plant and equipment. 2 Includes additions to property, plant and equipment and computer software, reported within intangible assets. Additional information 139 <strong>Vodafone</strong> Group Plc Annual Report 2013