The way ahead? - Vodafone
The way ahead? - Vodafone
The way ahead? - Vodafone

Create successful ePaper yourself
Turn your PDF publications into a flip-book with our unique Google optimized e-Paper software.
180<br />
<strong>Vodafone</strong> Group Plc<br />
Annual Report 2013<br />
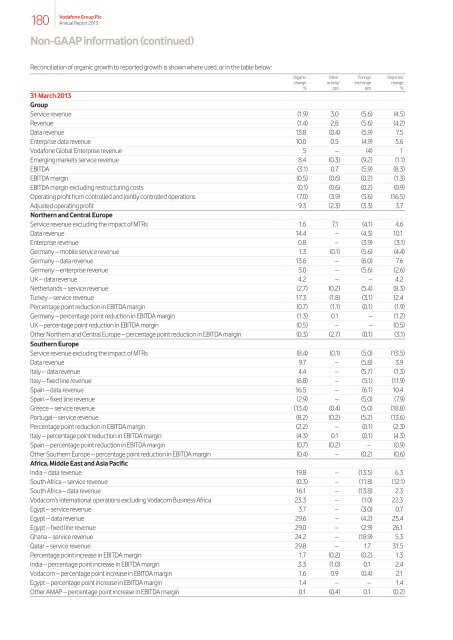
Non-GAAP information (continued)<br />
Reconciliation of organic growth to reported growth is shown where used, or in the table below:<br />
Organic<br />
change<br />
%<br />
Other<br />
activity 1<br />
pps<br />
Foreign<br />
exchange<br />
pps<br />
31 March 2013<br />
Group<br />
Service revenue (1.9) 3.0 (5.6) (4.5)<br />
Revenue (1.4) 2.8 (5.6) (4.2)<br />
Data revenue 13.8 (0.4) (5.9) 7.5<br />
Enterprise data revenue 10.0 0.5 (4.9) 5.6<br />
<strong>Vodafone</strong> Global Enterprise revenue 5 – (4) 1<br />
Emerging markets service revenue 8.4 (0.3) (9.2) (1.1)<br />
EBITDA (3.1) 0.7 (5.9) (8.3)<br />
EBITDA margin (0.5) (0.6) (0.2) (1.3)<br />
EBITDA margin excluding restructuring costs (0.1) (0.6) (0.2) (0.9)<br />
Operating profit from controlled and jointly controlled operations (7.0) (3.9) (5.6) (16.5)<br />
Adjusted operating profit 9.3 (2.3) (3.3) 3.7<br />
Northern and Central Europe<br />
Service revenue excluding the impact of MTRs 1.6 7.1 (4.1) 4.6<br />
Data revenue 14.4 – (4.3) 10.1<br />
Enterprise revenue 0.8 – (3.9) (3.1)<br />
Germany – mobile service revenue 1.3 (0.1) (5.6) (4.4)<br />
Germany – data revenue 13.6 – (6.0) 7.6<br />
Germany – enterprise revenue 3.0 – (5.6) (2.6)<br />
UK – data revenue 4.2 – – 4.2<br />
Netherlands – service revenue (2.7) (0.2) (5.4) (8.3)<br />
Turkey – service revenue 17.3 (1.8) (3.1) 12.4<br />
Percentage point reduction in EBITDA margin (0.7) (1.1) (0.1) (1.9)<br />
Germany – percentage point reduction in EBITDA margin (1.3) 0.1 – (1.2)<br />
UK – percentage point reduction in EBITDA margin (0.5) – – (0.5)<br />
Other Northern and Central Europe – percentage point reduction in EBITDA margin (0.3) (2.7) (0.1) (3.1)<br />
Southern Europe<br />
Service revenue excluding the impact of MTRs (8.4) (0.1) (5.0) (13.5)<br />
Data revenue 9.7 – (5.8) 3.9<br />
Italy – data revenue 4.4 – (5.7) (1.3)<br />
Italy – fixed line revenue (6.8) – (5.1) (11.9)<br />
Spain – data revenue 16.5 – (6.1) 10.4<br />
Spain – fixed line revenue (2.9) – (5.0) (7.9)<br />
Greece – service revenue (13.4) (0.4) (5.0) (18.8)<br />
Portugal – service revenue (8.2) (0.2) (5.2) (13.6)<br />
Percentage point reduction in EBITDA margin (2.2) – (0.1) (2.3)<br />
Italy – percentage point reduction in EBITDA margin (4.3) 0.1 (0.1) (4.3)<br />
Spain – percentage point reduction in EBITDA margin (0.7) (0.2) – (0.9)<br />
Other Southern Europe – percentage point reduction in EBITDA margin (0.4) – (0.2) (0.6)<br />
Africa, Middle East and Asia Pacific<br />
India – data revenue 19.8 – (13.5) 6.3<br />
South Africa – service revenue (0.3) – (11.8) (12.1)<br />
South Africa – data revenue 16.1 – (13.8) 2.3<br />
Vodacom’s international operations excluding Vodacom Business Africa 23.3 – (1.0) 22.3<br />
Egypt – service revenue 3.7 – (3.0) 0.7<br />
Egypt – data revenue 29.6 – (4.2) 25.4<br />
Egypt – fixed line revenue 29.0 – (2.9) 26.1<br />
Ghana – service revenue 24.2 – (18.9) 5.3<br />
Qatar – service revenue 29.8 – 1.7 31.5<br />
Percentage point increase in EBITDA margin 1.7 (0.2) (0.2) 1.3<br />
India – percentage point increase in EBITDA margin 3.3 (1.0) 0.1 2.4<br />
Vodacom – percentage point increase in EBITDA margin 1.6 0.9 (0.4) 2.1<br />
Egypt – percentage point increase in EBITDA margin 1.4 – – 1.4<br />
Other AMAP – percentage point increase in EBITDA margin 0.1 (0.4) 0.1 (0.2)<br />
Reported<br />
change<br />
%